Trip generation models provide a measure of the rate at which trips both in and out of the zone in question are made. They predict the total number of trips produced by and attracted to its zone. Centres of residential development, where people live, generally produce trips. The more dense the development and the greater the average household income is within a given zone; the more trips will be produced by it. Centres of economic activity, where people work, are the end point of these trips. The more office, factory and shopping space existing within the zone, the more journeys will terminate within it. These trips are 2-way excursions, with the return journey made at some later stage during the day.
It is an innately difficult and complex task to predict exactly when a trip will occur. This complexity arises from the different types of trips that can be undertaken by a car user during the course of the day (work, shopping, leisure, etc.). The process of stratification attempts to simplify the process of predicting the number and type of trips made by a given zone. Trips are often stratified by purpose, be it work, shopping or leisure. Different types of trips have different characteristics that result in them being more likely to occur at different times of the day. The peak time for the journey to work is generally in the early morning, while shopping trips are most likely during the early evening. Stratification by time, termed temporal aggregation, can also be used, where trip generation models predict the number of trips per unit timeframe during any given day. An alternative simplification procedure can involve considering the trip behaviour of an entire household of travellers rather than each individual trip maker within it. Such an approach is justified by the homogeneous nature, in social and economic terms, of the members of a household within a given zone. Within the context of an urban transportation study, three major variables govern the rate at which trips are made from each zone within the study area:
· Distance of zone from the central business district/city centre area
· Socio-economic characteristics of the zone population (per capita income, cars available per household)
· Intensity of land use (housing units per hectare, employees per square metre of office space)
The relationships between trips generated and the relevant variables are expressed as mathematical equations, generally in a linear form. For example, the model could take the following form:
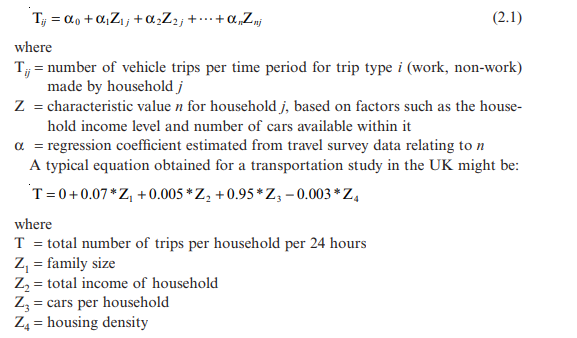
The coefficients a0 to an which occur within typical trip generation models as shown in equation 2.1 are determined through regression analysis. Manual solutions from multiple regression coefficients can be tedious and time-consuming but software packages are readily available for solving them. For a given trip generation equation, the coefficients can be assumed to remain constant over time for a given specified geographical location with uniform demographic and socio-economic factors.
In developing such regression equations, among the main assumptions made is that all the variables on the right-hand side of the equation are independent of each other. It may not, however, be possible for the transportation expert to conform to such a requirement and this may leave the procedure open to a certain level of criticism. In addition, basic errors in the regression equation may exist as a result of biases or inaccuracies in the survey data from which it was derived. Equation 2.1 assumes that the regression of the dependent variable on the independent variables is linear, whereas in reality this may not be the case.
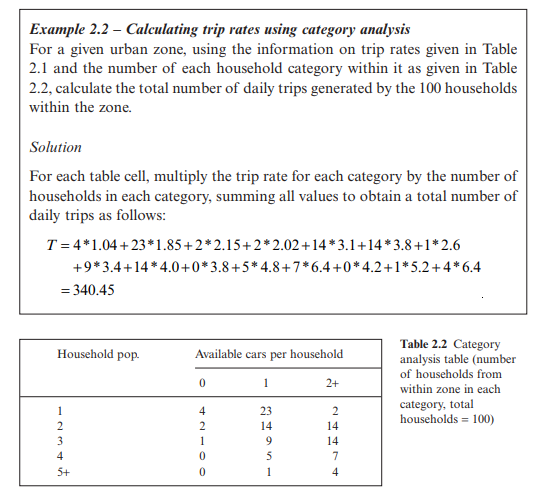
Difficulties with the use of regression analysis for the analysis of trip generations have resulted in support for the use of models with the person or, more often, the household, at its basis. This process of estimating trip generations directly from household data is known as category analysis. Within it, households are subdivided into smaller groupings that are known to possess set tripmaking patterns. Category analysis assumes that the volume of trips generated depend on the characteristics of households together with their location relative to places of work. These characteristics are easily measured. They include household income, car ownership, family size, number of workers within the household and housing density. The method does, however, assume that both car ownership and real income levels will increase in the future. This may not necessarily be the case.
For example, the more people within a household and the more cars available to them, the more trips they will make; say we define 15 subgroups in terms of two characteristics – numbers within the household and number of cars available – and we estimate the number of trips each subgroup is likely to make during the course of the day. An example of category analysis figures is given in Table 2.1.
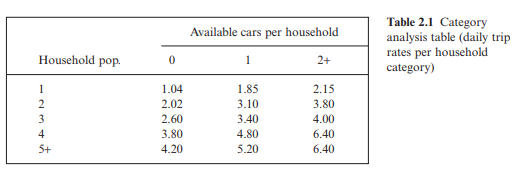
For the neighbourhood under examination, once the number of households within each subgroup is established, the total number trips generated each day can be calculated.