The problem of water leakages
Water is a daily necessary resource for life, health, economic development and the ecosystem all over the world. As water is precious to everyone, its availability and quality are essential. Climate change, droughts, water shortages and population growth are increasing the strain on existing water resources, thereby increasing the necessity to preserve and avoid water wastage through effective management and reduction of water losses.
A significant amount of water is lost in the water supply system. Water leakages have been a major problem for many regions around the world (Weifeng et al, 2011). In some countries water loss due to water leakages in the supply network exceeds 40% of the water in the supply system (Fig 1). Reduction of water leakages is an important goal for many countries in the world (Vairavamoorthy and Lumbers, 1998), as it will mean a reduction in the amount of money and energy required on producing and pumping water and also satisfaction of consumer needs through improved reliability of the system (Ayala–Cabrera et al, 2013).
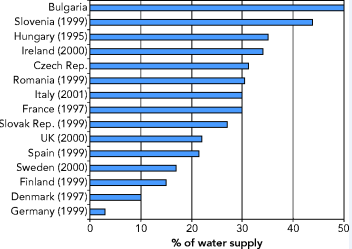
FIGURE 1.
Losses from urban water networks. (): Year of data. (http://www.eea.europa.eu/legal/copyright). Copyright holder: European Environment Agency (EEA, 2008).
The Eastern Mediterranean countries are expected to be affected adversely by climate change. Similar to other countries in this region, Cyprus has semi-arid climate with limited water resources (Zachariades, 2010). This, combined with the high water demand on the island, resulted in Cyprus having the highest Water Exploitation Index across Europe WEI (Fig 2). A WEI above 20 % implies that a water resource is under stress and values above 40 % indicate severe water stress and clearly unsustainable use of the water resource (Raskin et al., 1997).
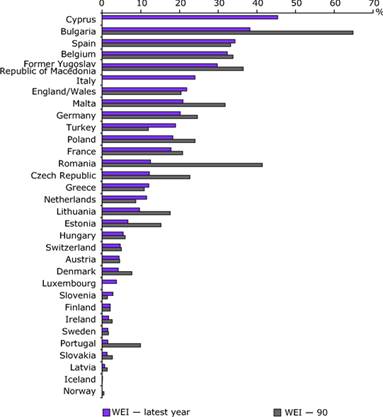
FIGURE 2.
Total water abstraction per year as a percentage of the total long-term renewable resource. (http://www.eea.europa.eu/legal/copyright). Copyright holder: European Environment Agency (EEA, 2008).
Traditional field survey methods are costly and time-consuming, as the timely identification and monitoring of leakages in the water supply network is a very complex task (Huang et al. 2010). Over the years, different non-intrusive techniques have been used to monitor and identify water leakage. These can be grouped as (a) visual techniques such as closed-circuit television, (b) electromagnetic and radio frequency techniques e.g. magnetic flux leakage, ground penetrating radar, (c) acoustic and vibration techniques like sonar, vibro-acoustics and (d) others such as infrared thermography, laser surveys (Ayala-Cabrera et al. 2013, Hadjimitsis et al. 2009, Eyuboglu et al. 2003).
Remote sensing and radar technology for water leakage detection
Remote sensing has been used for water management purposes over the years. Recent remote sensing techniques have been used in water leakage detection studies mainly through the use of Vegetation Indices (VI). Agapiou et al. (2012a) has divided VI into five main categories according to equation or the use of each index, which include broadband indices, narrowband indices (hyperspectral), leaf pigment indices, stress indices and water stress indices. They stated that VI can be simply divided according to the wavelength characteristics used in their formula (broadband and narrowband indices). A study by Pickerill and Malthus (1998) showed that the use of different VI and single bands were required for the identification of the water leaks. Work by Huang et al. (2009) indicated that the use of red, NIR and thermal bands is highly consistent with the field observations in the detection of water leakage in irrigation distribution networks. For their study, they used airborne multispectral remote sensing imagery with high-resolution imaging sensors in the visible, NIR and thermal infrared wavelengths.
This book describes the combination of satellite imagery, in-situ spectroradiometric data and radar techniques for the identification of water leakages in the water supply network in rural areas in Cyprus. The water mains network covers great distances in rural and sometimes inaccessible areas, and for most of the cases in Cyprus, the exact position of the network is not known. Therefore, tracing water leakages is a very costly, time consuming task adding to the already immense problem of water sustainability on the island. A complete geoinformation system providing the exact location, characteristics and relevant data for the water mains does not exist, making the leakage monitoring procedure even more complicated. This book presents a holistic approach combining new technologies for a complete system of water distribution network leakage detection management, which can be used in different countries to effectively identify and monitor water leakages.
Study-area
In order to identify and monitor water leakages, 3 case studies are described in this section: (a) Frenaros-Choirokoitia (b) Lakatamia and (c) Germasogeia water pipe network. The first case study Frenaros-Choirokoitia (Fig 3) is a major rural pipeline in Cyprus, which runs from the Choirokoitia area to the Frenaros area. The existing pipeline, which passes through the central and central-east part of Cyprus, has a length of over 65 km. The pipeline is located 1-3 meters below ground surface. Various geological formations, generating several soil types including calcaric cambisols, calcaric regosols, and epipetric calcisols, exist in the area, while the higher and lower elevation of the pipeline (ground surface) is estimated to vary between 10 m and 200 m above sea level. From 2007 to 2010, three major leakages were observed along different sections of the pipe (Fig 4). The locations of these leakages were not detected at once after the leakage occurred. The leakages occurred during 2007, 2008 and 2010; further details for these events are described later in the book.
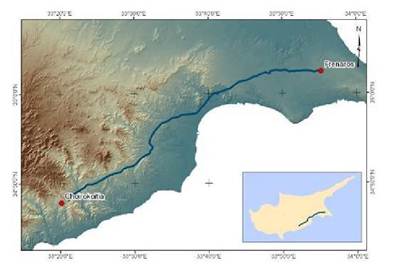
FIGURE 3.
The “Choirokoitia-Frenaros” water pipe
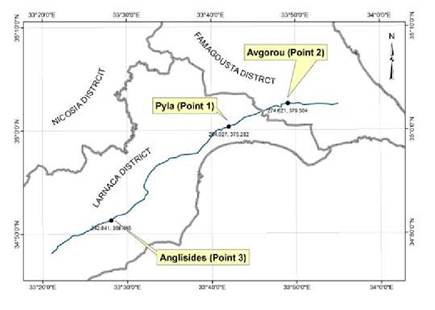
FIGURE 4.
Points 1-3 indicate the spots were water leakages have been reported in the “Choirokoitia-Frenaros” water pipe.
LAKATAMIA WATER PIPE
The Lakatamia water pipe (Fig 5) has a length of less than 5 km and has been systematically reported as problematic due to several leakages and it is therefore no longer in use by the local authorities. The pipe runs through urban and rural areas. A section of the pipeline, with a length of over 2km and located in a rural area, has been used for the detection of leakages. Since the existing water pipe is not currently in use, it was necessary to fill the pipe periodically with water to observe the effectiveness of such remote sensing non-contact techniques. The water pipe is made of UPVC and has 315mm diameter. It is between 1.80m and 2.00m below the ground surface and runs along the Pediaos River for a large part of its length. It is currently not being used due to water leakages occurring throughout almost the entire length of the pipeline. Information regarding the specific dates of events is not available from local authorities.
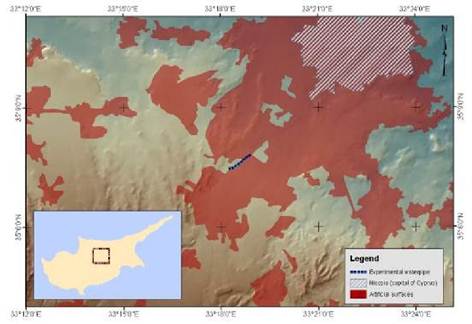
FIGURE 5.
The “Lakatamia” water pipe
GERMASOYEIA-MOUTAGIAKIA PIPELINE
The third case study was the “Germasoyeia-Moutagiakia” pipeline in the southern part of Limassol District in Cyprus. This pipeline runs through rough terrain, making visual inspections difficult. This pipeline was selected in order to evaluate the results from the satellite images.
Methodology
For all three case studies, the first step was to georeference the water pipes under examination. For the “Chroirokoitia-Frenaros” water pipe, all data regarding the characteristics of the pipeline were collected in CAD format from the Water Development Department-which is the responsible authority for the water pipe. In addition, the coordinates of the leakages were collected and added in a GIS environment. The GIS environment allows the researchers to identify potential areas which are suitable for the detection of the event, so they can be identified on satellite images. Soil, land use and meteorological data were also included in the GIS environment. A similar approach was followed for the “Germasoyeia-Moutagiakia” pipe line. The CAD file was converted into a :shp file and imported into a GIS database. For the pipeline in the area of Lakatameia, GPS measurements were carried out to map the path of the pipeline (Figure 6; Figure 7). Engineers from the municipality of Lakatameia also indicated problematic spots over the buried pipeline, which were recorded in the data. Figure 7 shows the pipeline as mapped from the GPS measurements (with red line, background Google Earth).
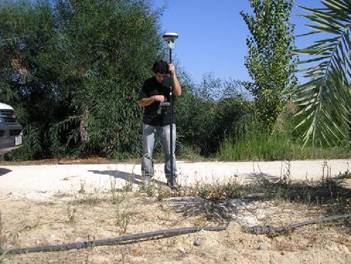
FIGURE 6.
GPS measurements in the Lakatameia pipeline.
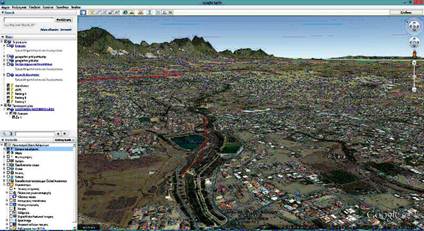
FIGURE 7.
Pipeline as mapped from the GPS measurements (with red line, background Google Earth).
Resources
The resources are grouped into three main categories: (a) high resolution satellite data used for the “Southern Conveyor Project” area; (b) spectroradiometric ground data used for the ”Lakatameia“ pipeline and (c) medium resolution satellite data used for the ”Choirokoitia-Frenaros“ pipeline. In addition, spectroradiometric hyperspectral measurements were carried out using the GER 1500 field spectroradiometer (Figure 8a). The GER 1500 spectroradiometer records electromagnetic radiation between 350 nm to 1050 nm (visible and near infrared part of the spectrum) A calibrated Spectralon panel, with ≈100% reflectance, was also used simultaneously to measure the incoming solar radiation. The Spectralon panel measurement was used as a reference, while the the crops were used for spectroradiometric measurements. Therefore, reflectance for each measurement can be calculated using the following:
| Reflectance = (Target Radiance / Panel Radiance) x Calibration of the panelReflectance = (Target Radiance / Panel Radiance) x Calibration of the panel |
In order to avoid any errors due to changes in the prevailing atmospheric conditions (Milton et al. 2009), the measurements over the panel and the target were taken within minutes of each other. The coordinates of the measurements were mapped using a Global Navigation Satellite Systems (GNSS) (Figure 8b).
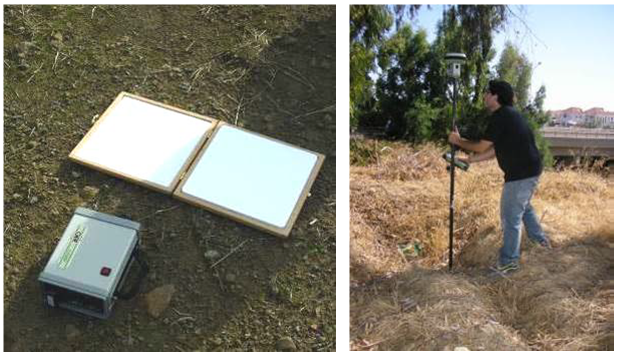
FIGURE 8.
a) (left): The GER 1500 spectroradiometer used for the collection of ground measurements and b) (right): the GNSS used for mapping the pipeline
In addition, spectroradiometric measurements were taken from a low altitude system (Figure 9). The spectroradiometer was attached to the air balloon and raised over the pilot study area. Measurements were taken at several heights in the pilot study area and also in the surrounding area in order to compare their spectral signature profiles. As the airborne system was raised, the pixel size of the ground increased.
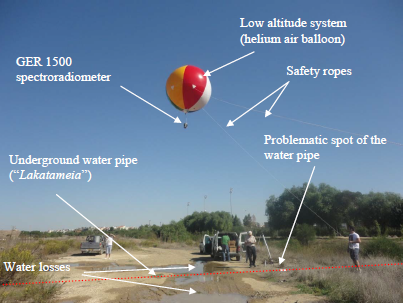
FIGURE 9.
The low altitude system for spectroradiometric data
Spectroradiometric data have also been used in order to form thresholds of reflectance and vegetation indices (VI) that indicate a ‘water leakage suspicious’ event. To do this, a great number of measurements were recorded and different vegetation indices were determined for soil and vegetation under ‘dry’ and under ‘wet’ conditions. This allowed the formation of ‘thresholds’ which imply a ‘water leakage suspicious’ event when reflectance values and vegetation indices fall within these thresholds. By observing satellite data and specifically reflectance and vegetation indices values, the authorities will identify ‘suspicious’ areas for water leakage. This will minimise the in-situ visits to only these suspicious areas, significantly reducing cost and time for the water authorities and gaining reliability and satisfaction for the consumers.
The final outcome of the various studies will be a geographical information system (GIS) that produces maps indicating specific locations where a water leakage may have occurred. As stated by Chorley (1987), a GIS is a system for collecting, storing, managing, analyzing and presenting data related to space. The core of a complete GIS system consists of three basic components that are in constant balance and interdependence. These are machines (hardware), algorithms (software) and available data (resources).The possibilities offered by GIS make them a valuable tool, as the ability of GIS to able to correlate different information in a spatial context, thereby creating relationships and conclusions. GIS can be used to emphasize the spatial relationships among the objects being mapped. Therefore, GIS can reveal important new information that leads to better understanding and decisions.
In order to design a GIS database, some basic steps must be followed. These steps include: (1) exterior design of the model, describing the real world (depending on the needs of users), (2) conceptual design, where a generalization of the real world is performed and final 3) the logical design where the implementation is made at a computer.
For the data of the three case studies described in this book, a customized GIS was developed to monitor changes regarding the pipelines both in space and in time. The continuous updating and monitoring of water pipelines can assist the public authorities to examine changes over time, based on a continuously feedback of the GIS database. Temporal GIS is an emerging capability for integrating temporal data with location and attribute data, enabling temporal visualization and ultimately temporal analysis.

Comments are closed