The stress-strain relation of any material is obtained by conducting tension test in the laboratories on standard specimen. Different materials behave differently and their behaviour in tension and in compression differ slightly.
Behaviour in Tension
Mild steel.
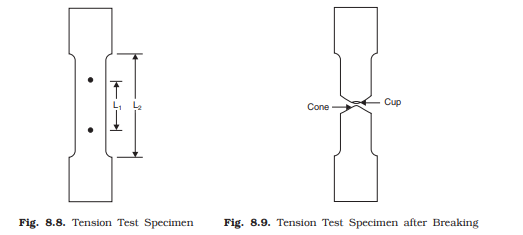
Figure 8.8 shows a typical tensile test specimen of mild steel. Its ends are gripped into universal testing machine. Extensometer is fitted to test specimen which measures extension over the length L1, shown in Fig. 8.8. The length over which extension is measured is called gauge length. The load is applied gradually and at regular interval of loads extension is measured. After certain load, extension increases at faster rate and the capacity of extensometer to measure extension comes to an end and, hence, it is removed before this stage is reached and extension is measured from scale on the universal testing machine. Load is increased gradually till the specimen breaks.
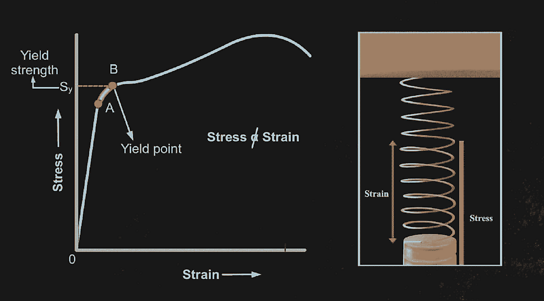
Load divided by original cross-sectional area is called as nominal stress or simply as stress. Strain is obtained by dividing extensometer readings by gauge length of extensometer (L1) and by dividing scale readings by grip to grip length of the specimen (L2). Figure 8.10 shows stress vs strain diagram for the typical mild steel specimen. The following salient points are observed on stress-strain curve:
(a) Limit of Proportionality (A): It is the limiting value of the stress up to which stress is proportional to strain.
(b) Elastic Limit: This is the limiting value of stress up to which if the material is stressed and then released (unloaded) strain disappears completely and the original length is regained. This point is slightly beyond the limit of proportionality.
(c) Upper Yield Point (B): This is the stress at which, the load starts reducing and the extension increases. This phenomenon is called yielding of material. At this stage strain is about 0.125 per cent and stress is about 250 N/mm2 .
(d) Lower Yield Point (C): At this stage the stress remains same but strain increases for some time.
(e) Ultimate Stress (D): This is the maximum stress the material can resist. This stress is about 370–400 N/mm2 . At this stage cross-sectional area at a particular section starts reducing very fast (Fig. 8.9). This is called neck formation. After this stage load resisted and hence the stress developed starts reducing.
(f) Breaking Point (E): The stress at which finally the specimen fails is called breaking point. At this strain is 20 to 25 per cent.
If unloading is made within elastic limit the original length is regained i.e., the stress-strain curve follows down the loading curve shown in Fig. 8.6. If unloading is made after loading the specimen beyond elastic limit, it follows a straight line parallel to the original straight portion as shown by line FF′ in Fig. 8.10. Thus if it is loaded beyond elastic limit and then unloaded a permanent strain (OF) is left in the specimen. This is called permanent set.
Stress-strain relation in aluminium and high strength steel.
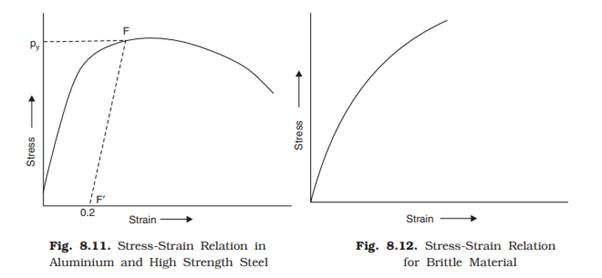
In these elastic materials there is no clear cut yield point. The necking takes place at ultimate stress and eventually the breaking point is lower than the ultimate point. The typical stress-strain diagram is shown in Fig. 8.11. The stress p at which if unloading is made there will be 0.2 per cent permanent set is known as 0.2 per cent proof stress and this point is treated as yield point for all practical purposes.
Stress-strain relation in brittle material.
The typical stress-strain relation in a brittle material like cast iron, is shown in Fig. 8.12.
In these material, there is no appreciable change in rate of strain. There is no yield point and no necking takes place. Ultimate point and breaking point are one and the same. The strain at failure is very small.
Percentage elongation and percentage reduction in area.
Percentage elongation and percentage reduction in area are the two terms used to measure the ductility of material.
(a) Percentage Elongation: It is defined as the ratio of the final extension at rupture to original length expressed, as percentage. Thus,
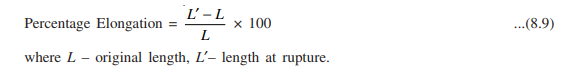
The code specify that original length is to be five times the diameter and the portion considered must include neck (whenever it occurs). Usually marking are made on tension rod at every ‘2.5 d’ distance and after failure the portion in which necking takes place is considered. In case of ductile material percentage elongation is 20 to 25.
(b) Percentage Reduction in Area: It is defined as the ratio of maximum changes in the crosssectional area to original cross-sectional area, expressed as percentage. Thus

where A–original cross-sectional area, A′–minimum cross-sectional area. In case of ductile material, A′ is calculated after measuring the diameter at the neck. For this, the two broken pieces of the specimen are to be kept joining each other properly. For steel, the percentage reduction in area is 60 to 70.
Behaviour of Materials under Compression
As there is chance to bucking (laterally bending) of long specimen, for compression tests short specimens are used. Hence, this test involves measurement of smaller changes in length. It results into lesser accuracy. However precise measurements have shown the following results:
(a) In case of ductile materials stress-strain curve follows exactly same path as in tensile test up to and even slightly beyond yield point. For larger values the curves diverge. There will not be necking in case of compression tests.
(b) For most brittle materials ultimate compressive stress in compression is much larger than in tension. It is because of flows and cracks present in brittle materials which weaken the material in tension but will not affect the strength in compression.