Evapotranspiration (ETc) is the mean for exploiting irrigation water and constitutes a major component of the hydrological cycle (Telis et al., 2007; Papadavid, 2011). The ETc is a basic and crucial parameter for climate studies, weather forecasts and weather modeling, hydrological surveys, ecological monitoring and water resource management (Hoedjes et al., 2008). In the past decades, the estimation of ETc combining conventional meteorological ground measurements with remotely-sensed data, has been widely studied and several methods have been developed for this purpose (Tsouni, 2003). For hydrological resources management and irrigation scheduling, an accurate estimation of the ETc is necessary to be considered (Hoedjes et al., 2008 ; Papadavid et al., 2011). Crop evapotranspiration rate is highly important in various areas of the agricultural sector such as for identification of crop stress, water deficiency, for estimating the exact potential needs of crops for best yields. It is well accepted that water depletion methods, such as lysimeters, are the most accurate methods for estimating ETc. Methods that use meteorological parameters in order to estimate the ETc of different crops are well established and used by various studies (Telis et al., 2007; Rogers et al., 2007). A number of semi-empirical methods have been also developed in order to estimate the evapotranspiration from different climatic variables (Courault et al., 2005). Remotely sensed reflectance values can be used in combination with other detailed information for estimating ETc of different crops. Indeed, the potentiality of remote sensing techniques in ETc estimation and water resource management has been widely acknowledged (Papadavid et al., 2010). The possibility for monitoring irrigation demand from space is an important factor and tool for policy makers. It has been found that saving irrigation water through remote sensing techniques could diminish farm irrigation cost which reaches 25% of the total costs and increases the margin of net profit (Papadavid et al., 2011). Several researchers such as D’Urso et al., (1992), Bastiaanssen (2000), Ambast et al., (2006) and Papadavid et al., (2011) have highlighted the potentiality of multispectral satellite images for the appraisal of irrigation management. The integration of remotely sensed data with auxiliary ground truth data for obtaining better results is common in the literature. (Bastiaanssen et al., 2003; Ambast et al., 2006; Minaccapili et al., 2008). Ambast et al., (2006) have shown that the application of remote sensing data in irrigation is of high importance because it supports management of irrigation and is a powerful tool in the hands of policy makers. It has been found that research in ETc is directed towards energy balance algorithms that use remote sensing directly to calculate input parameters and, by combining empirical relationships to physical models, to estimate the energy budget components (Minaccapili et al., 2008; Papadavid et al., 2010; Papadavid et al., 2011). All the remote sensing models of this category are characterized by several approximations and need detailed experimental validations. Multispectral images are used to infer ETc, which is the main input for water balance methods-models. For estimations of ET, ground truth data (Leaf Area Index-LAI, crop height) and meteorological data (air temperature, wind speed, humidity) is needed to support this approach. In nearly every application of water balance model, knowledge of spatial variations in meteorological conditions is needed (Moran et al., 1997).
The use of remote sensed data is very useful for the deployment of water strategies since it can offer a huge amount of information in short time, compared to conventional methods. Besides convenience and time reducing, remotely sensed data lessens the costs for data acquisition, especially when the area is extended (Thiruvengadachari et al., 1997). Although remote sensing based ETc models have been shown to have the potential to accurately estimate regional ETc, there are opportunities to further improve these models testing the equations used to estimate LAI and crop height for their accuracy under current agro-meteorological and soil conditions.
This Chapter discusses the implementation of the most widely used models for estimating ETc, the ‘SEBAL’ and ‘Penman-Monteith’ which are used with satellite data. Such models are employed and modified, with semi-emprical models regarding crop canopy factors, to estimate accurately ETc for specific crops in the Cyprus area under local conditions. Crop Water Requirements have been determined based on the evapotranspiration values.
Study area
The study area is located in the area of Mandria village, in the vicinity of Paphos International Airport in Paphos District in Cyprus (Figure 1). The study area lying in the southwest of Cyprus is a coastal strip between Kouklia and Yeroskipou villages. The area is a coastal plain with seaward slope of about 2% and it consists of deep fertile soils made of old fine deposits. The area is dissected by three major rivers, the Ezousa, Xeropotamos and Diarizos. The area is almost at sea level (altitude 15 m) and is characterized by mild climate which provides the opportunity for early production of leafy and annual crops. The uniform and moderate temperatures, attributed to the permanent sea breeze of the area, and the relative humidity, are conductive to the early production of fruits and vegetables, for which the reputation of the area is known all over Cyprus. Cereals are also cultivated in the area. A typical Mediterranean climate prevails in the area of interest, with hot dry summers from June to September and cool winters from December to March, during which much of the annual rainfall occurs with an average record of 425mm. Nevertheless, irrigation is indispensable for any appreciable agricultural development in the area
The selected area is a traditionally agricultural area with a diversity of annual and perennial cultivations and is irrigated by Asprokremnos Dam, one of the biggest dams of Cyprus.
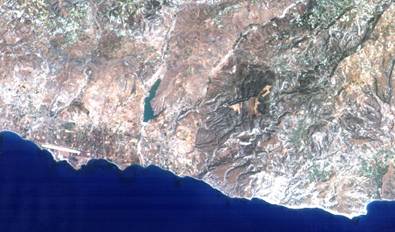
FIGURE 1.
Partial Landsat TM image of Mandria Village in the vicinity of Paphos International Airport in Cyprus
Resources
FIELD SPECTRORADIOMETER
The GER (Geophysical Environmental Research) 1500 field spectroradiometer (Figure 2,3) is a light-weight, high performance, single-beam field spectroradiometer. It is a field portable spectroradiometer covering the ultraviolet, visible and near-infrared wavelengths from 350 nm to 1050 nm. It uses a diffraction grating with a silicon diode array which has 512 discrete detectors and provides the capability to read 512 spectral bands.
The instrument is very rapidly scanning, acquiring spectra in milliseconds. The spectroradiometer provides the option for stand-alone operation (single beam hand-held operation) and the capability for computer assisted operation through its serial port, which offers near real-time spectrum display and hard disk data transfer. The maximum number of scans (512 readings), can be stored for subsequent analysis, using a personal computer and GER licensed operating software. The Lens barrel used for the specific spectroradiometer is the Standard 4 field of view. The data are stored in ASCII format for transfer to other software.
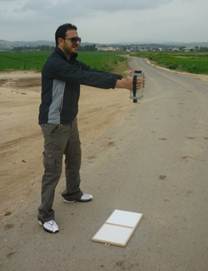
FIGURE 2.
Spectroradiometric measurement over spectralon panel (Papadavid, 2012)
Reflectance factors using a control stable surface with known characteristics as described by McCloy (1995) have been measured. Many researchers (McCloy, 1995; Beisl, 2001; Anderson and Milton, 2006; Schaepman, 2007; Papadavid 2012) highlight the advantages of using control surfaces in the measurement of reflectance factors (Bruegge et al., 2001). In this study, the control surface was a commercially available “Labsphere” compressed “Spectralon” white panel (Figure 2). There is evidence that these types of panels are more consistent and retain their calibration better than painted panels (Jackson et al., 1992; Beisl, 2001). Spectralon diffuse reflectance targets are ideal for laboratory and field applications such as field validation experiments, performed to collect remote sensing data due to the fact are: durable and washable; have typical reflectance values of 95% to 99% and are spectrally flat over the UV-VIS-NIR spectrum; are impervious to harsh environmental conditions and chemically inactive (Papadavid et al., 2011). Reflectance was calculated as a ratio of the target radiance to the reference radiance. The target radiance value is the measured value taken on the crops (Figure 3) and the reference radiance value is the measured value taken on the standard Spectralon panel (Figure 2), representing the sun radiance, which reaches the earth surface—without atmospheric influence.
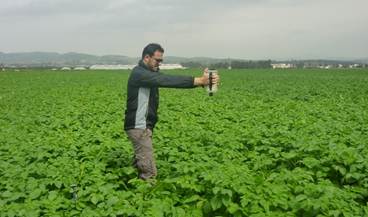
FIGURE 3.
Spectroradiometric measurements over potatoes (target) in Mandria Village in Paphos, Cyprus (Papadavid, 2012)
SUNSCAN CANOPY ANALYSER SYSTEM
Leaf Area Index is commonly used for monitoring crop growth. Instead of the traditional, direct and labor-consuming method of physically measuring the plant with a ruler (direct method), an optical instrument, SunScan canopy analyser system (Delta-T Devices Ltd., UK) is used (indirect method). The instrument (Figure 4) is indirectly measuring LAI by measuring the ratio of transmitted radiation through canopy to incident radiation (Figure 5). Indirect methods for LAI measurements based on the transmittance of radiation through the vegetation have been developed (Lang et al., 1991; Welles and Norman, 1991).
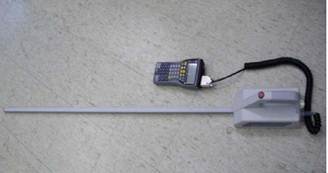
FIGURE 4.
SunScan (Delta-T) canopy analyser for LAI and crop height measurements
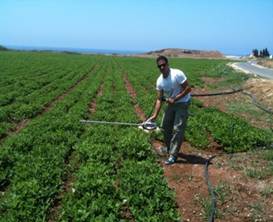
FIGURE 5.
Use of SunScan canopy analyzer for LAI measurements (Papadavid, 2012)
SATELLITE IMAGERY
Spatial, spectral and temporal resolution of satellite images is very important for studies dealing with crop water requirements. Landsat- 5 TM and -7 ETM+ have been widely used for hydrological studies due to their relatively good temporal resolution (16 days) which is important for providing regular snapshots during the crop growth season (Dadhwal et al., 1996; Song et al., 2001; Alexandridis, 2003). These sensors are suitable for agricultural areas with medium to big average fields due to their high spatial resolution (60m for thermal band, 15m for panchromatic and 30m for the rest).
However, the availability of images is highly dependent on weather conditions. The availability of cloud free images for operational projects is very important and depends on the geographical position and the prevailing weather conditions for the area of interest (Kontoes and Stakenborg, 1990; Hadjimitsis et al., 2000; Hadjimitsis et al., 2010). Countries such as Greece and Cyprus are characterised by good weather conditions and the availability of cloud-free images (Hadjimitsis et al., 2000). An advantage of Landsat image for applications in Cyprus is that of the whole island coverage from a single image which can be inferred on a regular basis since Landsat satellites overpass Cyprus on a systematic basis (Papadavid, 2011). Remote sensing users or policy makers or governmental officers have the oppotunity to have remotely sensed data very often which is very important in terms of phenological cycle monitoring.
D’ Urso (1995) and Minacapilly et al., (2008) explored the importance of using image time series due to the high importance of water requirements in the different stages of the crops. The same crop in different stage has different water needs, therefore the time series of satellite images is very important in studies regarding ETc and remote sensing. A time series of Landsat 5 TM and 7 ETM+ imagery acquired in years 2008, 2009 and 2010 are used in this study, as listed in Table 1. The crucial aim is to have satellite images in all stages of the specific crops. The availability of images is important since these images will be converted into ETc maps using an image processing software such as ERDAS Imagine software. Hence, the more images we have the better analysis we get. All images were pre-processed in order to remove atmospheric and radiometric effects, using the ERDAS Imagine software. ERDAS ‘modeller module’ was used to transform the images into maps by applying the ETc algorithms. The same satellite images were also used for evaluating the statistical models found, regarding Leaf Area Index (LAI) or Crop Height (CH) to one of the selected Vegetation Indices (VI).
Methodology
An attempt has been made to statistically describe the crop canopy factors, namely crop height (CH) and LAI, through the vegetation indices (VI). Crop canopy factors are vital elements in the procedure of estimating ETc. These indices were produced from spectroradiometric measurements using a hand-held field spectroradiometer (GER 1500) and after this data were filtered through the Relative Spectral Response (RSR) filters of the corresponding Landsat TM/ETM+ bands. At the same time LAI and CH direct measurements were taken in situ. Hence, time series of LAI, CH and VI have been created and were used to model LAI and CH to VI. After applying the needed regression analysis and evaluating them, the best model for each crop, based on the determination factor (r2), was used in specific ETc algorithms in a procedure to adapt and modify the algorithms in the geo-morphological and meteorological conditions of the island of Cyprus as a representative Mediterranean region.
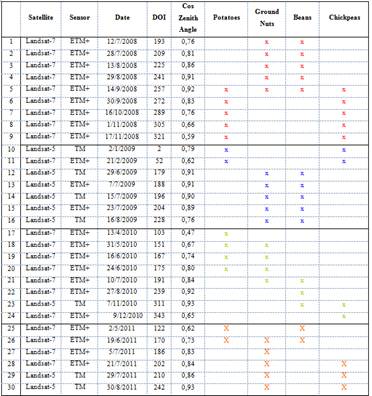
TABLE 1.
Landsat TM/ETM+ images used in this study (Papadavid, 2012)
Crop water requirements were inferred by applying the algorithms and it was tested to check if the specific modifications have assisted the algorithms to improve their precision when estimating ETc.
The overall methodology is described below. The intended purpose is to estimate ETc of specific crops in the area of interest using remote sensing techniques.
· Spectroradiometric measurements were undertaken for two years (2009-10) in order to collect spectral signatures of each crop included in the study. For each crop (Potatoes, Groundnuts, Beans and Chickpeas) the average spectral signature in each phenological stage was created based on the two cultivating periods (2009-2010). The purpose is to have the reflectance of each crop during their phenological stages after the data was filtered through the Relative Spectral Response filters.
· Leaf Area Index (LAI) and Crop Height (CH) measurements were also taken simultaneously to spectroradiometric measurements and following the same phenological cycle of each crop for the corresponding cultivating periods. The purpose was to create time series of these two parameters to correlate them to Vegetation Indices (VI).
· Development of vegetation indices (VI). Time series of VI were created based on the reflectance of each crop, in each phenological stage.
· Modeling VI to LAI and CH. Different models were tested in order to identify the best possible model which better describes LAI and CH through VI.
· Preprocessing of satellite images was applied. Geometric rectification, radiometric correction including atmospheric correction of satellite data were applied before main processing of the data.
· Mapping LAI, CH and albedo was performed. The three crop canopy parameters were mapped using the ERDAS Imagine v.10 software. The satellite images were transformed into maps in order firstly to test in practice the models and secondly to be inserted as inputs in ETc algorithms.
· Models verification. After inferring the best model describing LAI or CH using VI, an evaluation of this procedure was taking place. A priori knowledge of satellite over passing over the area of interest has assisted the procedure of taking LAI and CH measurements in different plots and different cultivating period. These average measurements were compared to the predicted measurements arising from the models application found in the previous step.
· Application of ETc algorithms. Original and modified by previous equations, ETc algorithms have been applied to check, based on the reference method, if and how the models have boosted accuracy on estimating ETc for each crop.
Ground data
SPECTRAL SIGNATURES OF CROPS
It is well established that the reflectance and transmission spectrum of leaves is a function of both the concentration of light absorbing compounds (chlorophylls, carotenoids, water, cellulose, lignin, starch, proteins, etc.) and the internal scattering of light that is not absorbed or absorbed less efficiently (Newnham and Burt, 2001; Dangel et al., 2003). Each crop has a different spectral signature depending on the stage of its phenological cycle (Gouranga and Harsh, 2005; McCloy, 2010; Papadavid et al., 2011). A general view of the vegetation spectral signature is shown in Figure 6; there is strong absorption in blue and red part of the light spectrum while at green and infrared part there is light and strong reflectance, respectively.
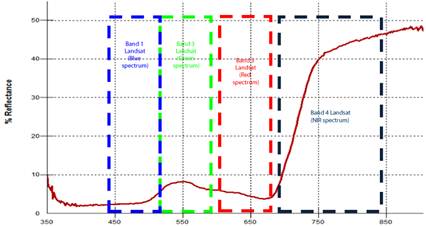
FIGURE 6.
Vegetation spectral signature: Vegetation has low reflectance in the visible region and high reflectance in the near infrared (data analysis)
The domain of optical observations extends from 400 nm in the visible region of the electromagnetic spectrum to 2500 nm in the shortwave infrared region. The strong absorption of light by photosynthetic pigments dominates green leaf properties in the visible spectrum (400-700nm). Leaf chlorosis causes an increase in visible reflectance and transmission. The near-infrared region (NIR, 700-1100 nm) is a region where biochemical absorptions are limited to the compounds typically found in dry leaves, primarily cellulose, lignin and other structural carbohydrates (Wang et al., 2005). However, foliar reflection in this region is also affected by multiple scattering of photons within the leaf, related to the internal structure, fraction of air spaces, and air-water interfaces that refract light within leaves. The reflectance and transmittance in the middle-infrared also termed the shortwave-infrared (SWIR, 1100 nm – 2500 nm) is also a region of strong absorption, primarily by water in green leaves (Maier, 2000). More specifically, visible blue and red are absorbed by the two main leaf pigments, chlorophyll a and b in green-leaf chloroplasts. These strong absorption bands induce a reflectance peak in the visible green. Thus most vegetation has a green-leafy color. Chlorophyll pigments are also known as the green pigments.
Apart from chlorophyll, other leaf pigments have a significant effect on the visible spectrum. Carotene, a yellow to orange-red pigment strongly absorbs radiation in the 350-500 nm range and is responsible for the color of some flowers and leaves without chlorophyll. Xanthophyll, the red and blue pigment also strongly absorbs radiation in the 350-500 nm range, giving the distinctive color to the leaves in Autumn. In the near infrared range (700-1000 nm) of the electromagnetic spectrum, there is strong reflectance in the spongy mesophyll cells that occur at the back of leaves.
PHENOLOGY OF THE CROPS
Phenology can be defined as the study of the timing of biological events, the causes of their timing with regard to biotic and abiotic forces, and the interrelation among phases of the same or different species (Shaykewich 1994). As McCloy (2010) mentions the phenological cycle can be defined as the trace or record of the changes in a variable or attribute over the phenological period (usually one agricultural year) and a phenophase is defined as an observable stage or phase in the seasonal cycle of a plant that can be defined by start and end points. Crop phenological stages are important indicators in agricultural production, management, planning, decision-making and irrigation scheduling (O’ Leary et al., 1985; Gouranga and Harsh, 2005; Papadavid et al., 2011). Indeed, Food and Agriculture Organization (FAO) guidelines of estimating crop evapotranspiration for irrigation demands, take into account crop characteristics and the phenological stages of a crop; Crop coefficient (Kc )refers to crop growth stage and the length in time of this stage (Allen et al., 1998). Moreover crop phenology is difficult to be studied for large areas using traditional techniques and methods.
Recently, many studies have been performed in order to derive the crop phenological stages based on satellite images (Papadavid, 2011). These studies aim to validate vegetation indices for monitoring the development of the phenological cycle from times series data (Papadavid, 2011). For example, Sakamoto et al., (2005), Minaccapili et al., (2008) and Papadavid et al., (2011) used times series of remotely sensed data in order to develop a new systematic method for detecting the phenological stages of different crops from satellite data while Bradley et al., (2007) in their study have introduced a curve fitting procedure in order to derive inter-annual phenologies from time series of noisy satellite NDVI data. Moreover, Funk and Budde (2009) have used an analogous metric of crop performance based on time series of NDVI satellite imagery. Papadavid et al., (2009; 2010; 2011) and Papadavid (2011) have shown that field spectroscopy and empirical modelling, when successfully integrated, can develop new models of Leaf Area Index (LAI) and Crop Height, during the phenological cycle of crops.
Tables indicating the phenology of each crop can be found in the FAO internet site (www.fao.org). Table 2 indicates the phenological stages of each crop and the number of in situ measurements (spectroradiometric and LAI/CH) taken at each stage.
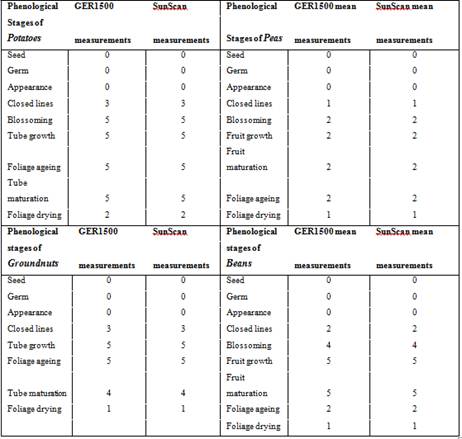
TABLE 2.
Phenological stages of each crop (Papadavid, 2012)
In each sub-table, the phenological stages of each crop can be seen in the first column. In the ‘GER 1500’ column the number of spectroradiometric measurements taken at each stage are presented. For example, for Potatoes the measurements begun at the stage of ‘closed lines’ and there were 3 measurements during that stage (each measurement in the table is the average measurement from 25 measurements well spread in the plot. In the third column labelled ‘Sunscan measurements’ the LAI measurements are presented for each phenological stage as for the second column which were taken simultaneously. The number of each spectroradiometric measurement is not random. There should be a change in the reflectance in the specific phenological stage to have another measurement meaning that the crop reflectance during two consecutive days could be the same so the measurement would not enter the table as different one.
Changes in the phenological cycles of crops may occur from different parameters, such as weather conditions, soil and crop characteristics, and changes in the climate of an area (Minaccapili et al., 2008; Kross et al.,2011). Between years, phenological markers (such as length of growing season) may respond differently, a phenomenon which can be associated with short-term climate fluctuations or anthropogenic forcing, such as groundwater extraction, urbanization (Bradley et al., 2007). However, the interpretation of phenological changes based on a large dataset volume for a period of many years can turn to be very complicated.
Semi-empirical modelling of satellite data (vegetation indices) to ground data (crop canopy parameters)
The commonly accepted equation for estimating evapotranspiration, according to the schematization of Monteith (Monteith and Unsworth, 1990), is a function of climate data such as temperature (T), humidity (RH%), solar radiation (Rs) and wind speed (U) and crop parameters, such as the surface albedo (a), the leaf area index (LAI) and the crop height (CH):
Remote sensing techniques can be used for monitoring these vegetation characteristics. An analytical elaboration performed on Landsat reflectance values evidenced the possibility of retrieving the surface albedo (Brest and Goward, 1987), the leaf area index (Price, 1992) and the crop height (Moran and Jackson, 1991). Since these parameters directly affect the reflectance of cropped areas, it has been demonstrated that it is possible to establish a correlation between multispectral measurements of canopy reflectance and the corresponding canopy parameter’s values (Bausch and Neale, 1987). In this study, the required crop parameters, a, LAI, CH have been derived from direct measurements and were correlated to reflectance measurements of the crops in each case.
Many studies have illustrated the need and the know-how for modeling or correlating LAI and Crop Height to remote sensing data and mainly to the vegetation indices inferred from handheld sensors. Leaf Area Index is an important structural property of crop canopy. High correlations were found between reflectance factor and LAI by Ahlrichs et al., (1983). Strong correlations between spectral data from crops and various characteristics of crops have been elucidated in numerous studies (Serrano et al, 2000; Goel et al., 2003; Lee et al., 2004). Darvishzadeh et al., (2008) examined the utility of hyper spectral remote sensing in predicting canopy characteristics by using a spectral radiometer. Among the various models investigated, they found that canopy chlorophyll content was estimated with the highest accuracy. Some studies used multispectral image sensor system to measure crop canopy characteristics (Inoue et al., 2000)
Quantification of the canopy leaf area index (LAI) and its spatial distribution provides (Figure 7) an avenue to improve the interpretation of remotely sensed data over vegetated areas. The purpose is to test the existing relation between vegetation indices with LAI and crop height and their prediction from remotely sensed data. It allow us to compare, on a consistent basis, the performance of a set of indices found in international literature, in the prediction of LAI and CH which are basic parameters in the algorithms of estimating ETc. The method for mapping LAI and Crop Height for specific crops is shown in Figure 8.
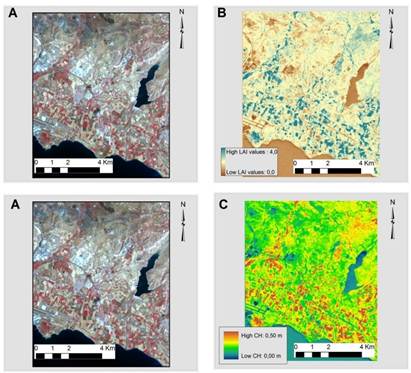
FIGURE 7.
Production of LAI (B) and CH (C) maps (in pseudo color) using a Landsat image (A) (Papadavid, 2011)
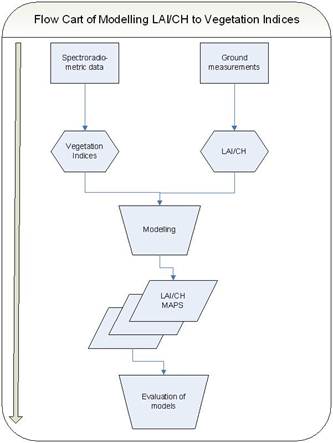
FIGURE 8.
Method for mapping LAI and Crop Height using in situ and satellite remotely data
Algorithms application and results
SEBAL ALGORITHM
SEBAL is a thermodynamically based model, using the partitioning of sensible heat flux and latent heat of vaporization flux as described by Bastiaanssen et al., (1998) who developed the algorithm. In the SEBAL model, ETc is computed from satellite images and weather data using the surface energy balance as illustrated in Figure 9. Remotely sensed data in the visible, near-infrared and thermal infrared bands are used to derive the energy balance components along with ground measured solar radiation, if available. The other ground measurements that are required as model input are air temperature, relative humidity and wind speed at a point within the image.
SEBAL has an internal calibration for removing atmospheric effects using a series of iteration on Sensible Heat Flux (H) (Baastianssen et al., 2000; 2008). Since the satellite image provides information for the overpass time only, SEBAL computes an instantaneous ET flux for the image time. The ET flux is calculated for each pixel of the image as a “residual” of the surface energy budget equation:
where:
· Rn is the instantaneous net radiation (W.m-2)
· G is the instantaneous soil heat flux (W.m-2),
· H is the instantaneous sensible heat flux (W.m-2)
· λΕΤ is the instantaneous latent heat flux (W.m-2)
In this equation, the soil heat flux (G) and sensible heat flux (H) are subtracted from the net radiation flux at the surface (Rn) to compute the “residual” energy available for evapotranspiration (λET) (Figure 8). Soil heat flux is empirically calculated using vegetation indices, surface temperature and surface albedo. Sensible heat flux is computed using wind speed observations, estimated surface roughness and surface to air temperature differences. SEBAL uses an iterative process to correct for atmospheric instability due to the buoyancy effects of surface heating. Once the latent heat flux (λET) is computed for each pixel, an equivalent amount of instantaneous ET (mm/hr) is readily calculated by dividing by the latent heat of vaporization (λ). Then, daily ETc is inferred.
When all parameters in Equation (2) are known, an instantaneous estimation of ETc can be conducted. Latent heat flux (λET) in Equation (3) is the rate of latent heat loss from the surface due to evapotranspiration, at the time of the satellite overpass. An instantaneous value of ETcinst in equivalent evaporation depth is computed as:

· ETcinst is the instantaneous evapotranspiration (mm/hr)
· 3600 is the time conversion from seconds to hours
· λ is the latent heat of vaporization or the heat absorbed when a kilogram of water evaporates (J/kg)
The Reference ET Fraction (ETrF) (Equation 4) is defined as the ratio of the computed instantaneous ET (ETinst) for each pixel to the reference ET (ETr) computed only from weather data:

· ETr is the reference ET at the time of the image from the REF-ET software (mm/hr). ETrF is also known as crop coefficient, Kc. ETrF is used to extrapolate ET from the image time to 24-hour or longer periods. ETrF values usually range from 0 to 1.
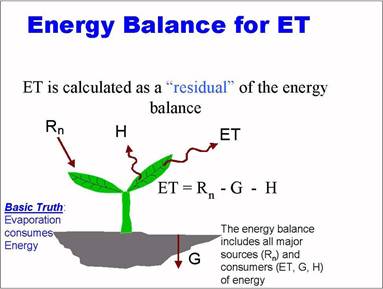
FIGURE 9.
Energy Balance equilibrium (Source: Waters et al., 2002)
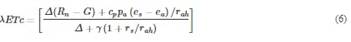
Finally, to get the daily values of ETc which are more useful than the instantaneous ones, SEBAL computes the ETdaily by assuming that the instantaneous ETrF is the same as the 24-hour average. The daily ETc (mm/day) is computed from Equation 5:

· ETr (24h) is the total reference evapotranspiration of the day in mm/day.
Daily ETc is the final ‘product’ of SEBAL algorithm, meaning that satellite images are transformed into ETc maps where one could retrieve ETc for each pixel, as it is shown in Figure 10.
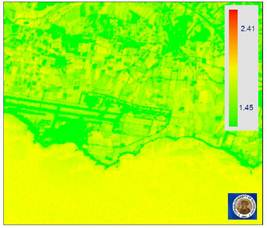
FIGURE 10.
ETc map of the area of interest (Landsat 5 TM image 2/1/2009) using SEBAL (Papadavid, 2011)
PENMAN-MONTEITH ADAPTED TO SATELLITE DATA ALGORITHM
Penman-Monteith method adapted to satellite data was used to estimate ETc in mm/day (Equation 6). The specific equation needs both meteorological and remotely sensed data to be applied. The equation is used to estimate ETc under some assumptions and depends on the direct application of the Penman-Monteith equation (Monteith, 1965; Rijtema, 1965; Smith, 1992; Allen et al., 1998) also based on EB theory, with canopy parameters estimated from satellite imagery (D’Urso et al., 2006; Minaccapili et al., 2008; Papadavid et al., 2010; 2011). Air temperature, atmospheric pressure, wind speed and other necessary meteorological data were collected from a weather station, located at the Paphos International Airport, very close to our study area. The method also needs empirical equations for describing the crop canopy factors (similar to SEBAL), namely albedo, crop height and LAI. It is a method with strong likelihood of correctly predicting the crop evapotranspiration in a wide range of locations and climates and has provision for application in data-sparse situations. The equation has a strong theoretical basis, combining an energy balance to account for radiation and sensible heat transfer with an aerodynamic transport function to account for transfer of vapor away from the evaporating surface. The method is described as follows:
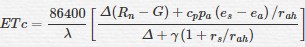
where
· ETc is the crop evapotranspiration (mm/day)
· Δ represents the slope of the saturated vapor pressure temperature relationship (kPa / K1)
· Rn is the net solar radiation (W/m2)
· G Soil Heat flux (W/m2)
· cp is the air specific heat (J/kg K)
· ρa is the air density (kg / m3)
· es is the saturated vapor pressure (kPa)
· ea is the actual vapour pressure (kPa)
· rah is the aerodynamic resistance (s/m)
· rs is the surface resistance (s/m)
· λ is the latent heat of vaporisation of water (J / kg)
· γ is the thermodynamic psychrometric constant (kPa / K)
This equation is valid under conditions of intense solar irradiance (typical summer condition in Mediterranean climate) and for 0,5 < LAI < 3, which is the case for Cyprus annual crops. What is important in the specific model is that of its use without the need of the thermal band of any satellite, contrary to the other Energy Balanced based models which thermal band is a prerequisite (Papadavid et al., 2011). Another difference that is rising in this model compared to SEBAL, is the need of atmospheric corrections where SEBAL and other models have an internal calibration for compensating atmospheric effects. The parameters Δ, G, u2, es–ea, Rn and Δ are calculated according to the formulae of the method by the conventional data of the meteorological station situated in the area of interested. The formulae for calculating each parameter can be found extensively in ‘FAO Irrigation and Drainage paper No. 56’ by FAO (1998). As in all ETc algorithms the final product is an ETc maps (Figure 11) of the area of interest where users can infer the ETc values for specific crops.
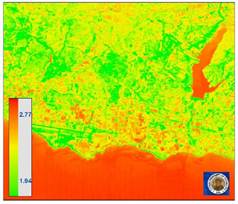
FIGURE 11.
ETc map of the area of interest (Landsat 7 TM image 2/1/2009) using P-M (Papadavid, 2011)
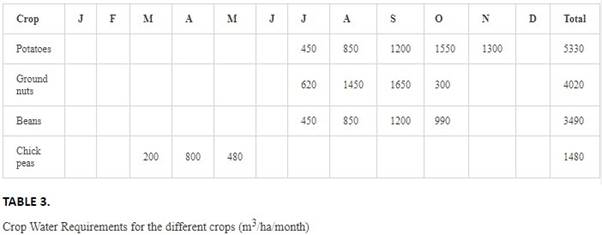
The results regarding crop water requirements of the different crops can be found on Table 3. The water needs for each crop is average value, for each month, based on the crop evapotranspiration found employing the two algorithms described above, after applying the methodology for modeling crop parameters to satellite data.
Use of wireless sensors for supporting evapotranspiration measurements and smart management of irrigation demand
Wireless sensors have been used in this study as an extra tool for supporting evapotranspiration measurements in the same area of interest (Hadjimitsis et al., 2008a & 2008b). Such sensors were used as smart meteorological stations (relative humidity, temperature, wind speed) as well as tools for retrieving soil moisture, soil temperature leaves wetness and temperature. These information can be used to assess our evapotranspiration results.
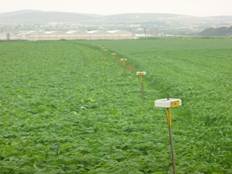
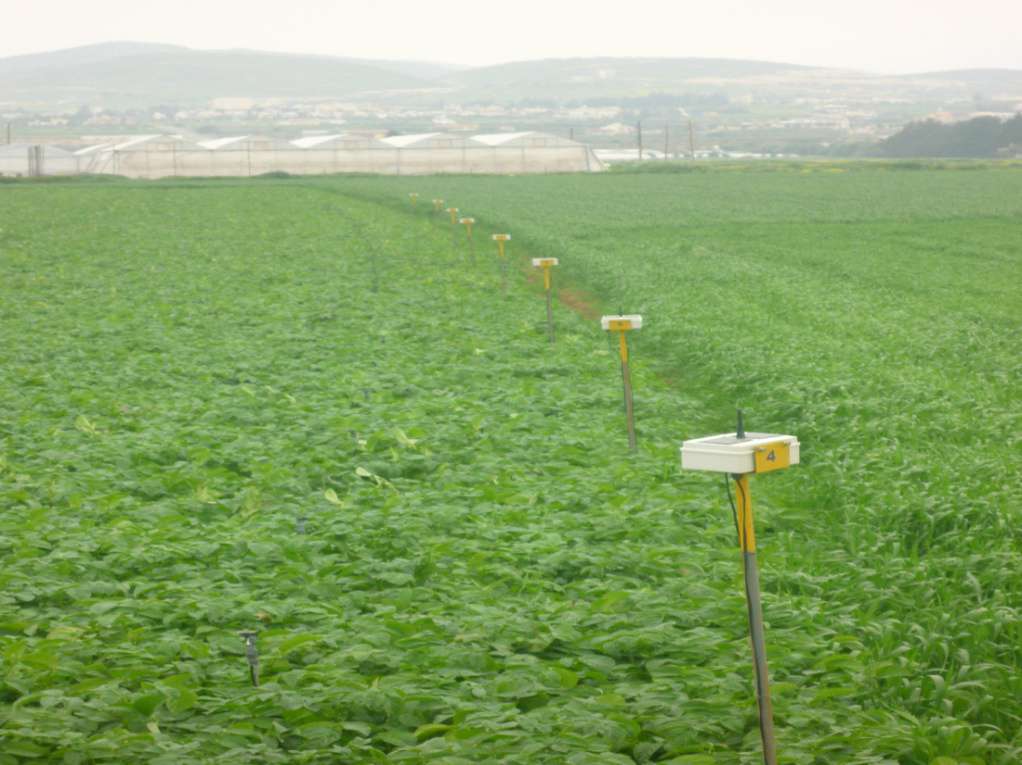
FIGURE 12.
Wireless nodes in the Mandria area in Paphos (Papadavid, 2012)
The Wireless Sensor Network (WSN) consisted of a number of wireless nodes (near to 20 nodes) placed at various locations in the surrounding agriculture fields irrigated from the Asprokremmos Dam in Paphos District area in Cyprus (see Figure 12). The WSN acts as a wide area distributed data collection system deployed to collect and reliably transmit soil and air environmental data to a remote base-station hosted at Cyprus University of Technology (at the Remote Sensing Laboratory), as shown in Figure 13.
The micro-sensors were deployed using ad-hoc multi-hop communication protocol and transmit their data to a gateway which is responsible to collect, save and forward them to a remote database through a GPRS connection. The solar powered gateway, shown in Figure 14, was equipped with various meteorology sensors required to assist the indeed research project such as rain, wind, barometric pressure, temperature etc, which give additional information to the system. The gateway also hosts a GPS sensor for identifying the exact position of the WSN an event-driven smart camera for acquiring real-time pictures of the area and also a GPRS modem for communicating with the remote server which is deployed tens of thousands of kilometers away. The absence of power and communication infrastructure was tackled by creating a fully solar operated gateway (autonomy of three days without sunshine) and by incorporating a low power GPRS modem for communication. A multi-parameter decision system running on the remote server would be able to process the sensor data and produce valuable information about watering different vegetables and create early notifications and suggestions which are then distributed to farmers and water management authorities. The system was able to process multi parameter data collected from different sensors such as soil moisture, soil temperature (Figures 15 and 16), leaves wetness and temperature, humidity, rainfall, wind speed and direction and ambient light.
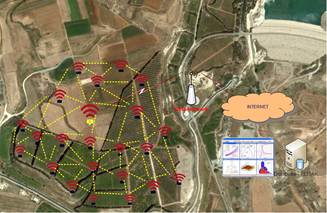
FIGURE 13.
Wirelesses Sensor Network Schema (Hadjimitsis et al., 2008a & 2008b)
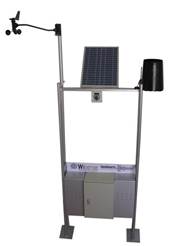
FIGURE 14.
The WSN Gateway and Meteorology Station (Hadjimitsis et al., 2008a & 2008b)
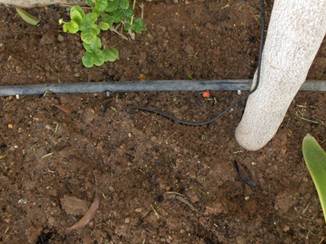
FIGURE 15.
Soil moisture measurements using micro-sensor technology in agricultural field
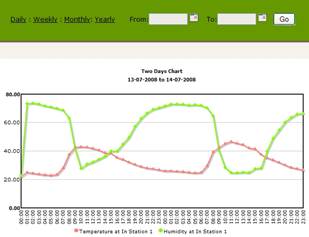
FIGURE 16.
Temperature measurements coming from MSN.
Smart management of evapotranspiration using 3G telephony
As ETc is calculated each night based on that day’s both weather readings and satellite images using the previously described method, the ETc results from these calculations are sent to farmers each morning giving them the water balance (Crop water requirements) for their area for the irrigation season until the previous day. Using the existing method by combining satellite-derived crop coefficients and the 3G telephony with SMS delivery service, now offers the potential to provide low cost, site specific and personalised (for crop type and management conditions) irrigation water management information to individual famers across an irrigation region (Papadavid et al., 2012). Automatically triggered text messages can be generated by server-based software that combine data and formatting and then send the message out to mobile phones via an Internet cellular network gateway services. 3G phones can not only send SMS but can also send extended multimedia.
High spatial resolution of water management information (approx. 30 m x 30 m using Landsat 5) allows farmers to better manage spatial variability to maximise production, minimise costs and environmental impacts.
Concluding remarks
As a key component in water resources management, it is essential to estimate evapotranspiration accurately for water resources evaluation, drought monitoring and crop production simulation. Accurate estimates of ETc are needed for numerous agricultural and natural resource management procedures. However, this is difficult to achieve in practice because actual evapotranspiration cannot be measured directly and varies considerably in time and space.
Satellite images are collected across Mediterranean areas with frequencies ranging from daily to monthly. The clear skies enable the gathering of good quality information and it is now possible to use satellite remote sensing to estimate the rates of ETc as shown in this chapter. Research has shown that there is a direct relationship between vegetation cover such as indices and ETc. This means that the standard approach of using static crop water requirement look-up tables can be improved by using the more dynamic and customised information provided by satellite imagery. Satellite Remote sensing can assist in improving the estimation of ETc, and consequently water demand in cultivated areas for irrigation purposes and sustainable water resources management.
In this Chapter remotely sensed data along with meteorological data, modeling techniques and surface energy balance algorithms were combined. All these procedures combined can provide the spatial distribution of ETc in maps where users can derive the value of ETc for each crop in mm/day. The methodology followed can be applied for any place since it can be considered as ‘algorithm adaptation’ to local conditions. The parameters that are required in the empirical equations can be easily evaluated using remote sensing techniques and field spectroscopy. Modeling techniques (for example, regression analysis) are used to correlate and evaluate measured crop canopy factors, such as Leaf Are Index (LAI) and Crop Height (CH), to remotely sensed data uring the entire phenological cycle of each crop. The intention is to create semi-empirical models describing LAI and CH, which are indispensible parameters in almost all ETc algorithms, using remotely sensed data. Using these models, users can avoid direct measurements of these parameters every time there is an application of an ETc algorithm.
The methodology as described in this chapter can support decision makers of Water Authorities. The methodology was applied for Landsats’ images but it can easily be adapted for other satellite sensors. The use of field-spectroradiometer can facilitate the procedure since it provides a spectrum which can be adapted to satellites’ bands by simple transformation, using relative spectral response (RSR) filters of each satellite.
