Water leakages have been a major problem for many regions around the world (Weifeng et al. 2011). However, monitoring such leakages is a difficult task since traditional field survey methods are costly and time consuming (Huang et al. 2010). Researchers from diverse scientific fields have studied this problem through the development of several techniques including radar technique, geophones, gas filling, and many others. Different conventional techniques such as acoustics, radioactive, electromagnetic, ground penetrating radar and linear polarization resistance have been used over the years for water pipeline leakage detection (Skolnik, 1990; Heathcote and Nicholas, 1998; Hunaidi and Giamou, 1998; Eyuboglu et al., 2003; Burn et al., 2001; Hadjimitsis, et al., 2009).
Remote sensing has been used for a wide range of applications including water management. Studies have shown promising results from its use for water leakage detection (Sheikh Naimullah, 2007). The uses of remote sensing techniques for water leakage detection are time and cost effective compared with traditional, intrusive methods, but their use is restricted due to their spatial resolution. The pipeline leakages occur along the length of the pipeline and the area affected may not be detectable by the satellite sensor as it depends on the pixel size and the density of the vegetation developed due to the presence of water.
Vegetation indices (VI) are the main form of satellite spectral data used for several applications. According to Agapiou et al. (2012a), VIs can be divided into five main categories according to equation or the use of each index, which include broadband indices, narrowband indices (hyperspectral), leaf pigment indices, stress indices and water stress indices. They reported that VI can be simply divided according to the wavelength characteristics used in their formula (broadband and narrowband indices). Using airborne remotely sensed imagery, Pickerill and Malthus (1998) analyzed two known water leaks and found that different vegetation indices and single bands were required in order to identify each leak. The spectral profile of one leak responded best to a ratio of NIR to red reflectance, while in the other, NIR to red reflectance ratio was not useful in differentiating it from its surroundings.
Huang et al. (2009) used airborne multispectral remote sensing imagery with high-resolution imaging sensors in the visible, NIR and thermal infrared wavelengths and found that airborne multispectral imaging is a useful tool in the detection of irrigation canal leakage in distribution networks. They concluded that the analysis of the processed image data from red, NIR and thermal bands is highly consistent with the observations from field investigation. Images from individual bands, particularly from the thermal band, can help detect leakage from irrigation canals. The NDVI image, which combines the data from the red and the NIR bands, can help detect and correct errors observed on the thermal imagery.
On-site observation, which consists of data collection, periodical observations, and multivariate risk assessment analysis, is the most common technique of monitoring the water pipe network in Cyprus. However, this is difficult to accomplish with traditional methods since it is time consuming, expensive and monitoring is localized. Furthermore, part of the water network tends to be located in inaccessible areas, away from the main road network and urban areas. A complete geoinformation system providing the exact location, characteristics and relevant data for the water mains does not exist, making the leakage monitoring procedures even more challenging.
This paper presents the results from a project which combines different remote sensing technologies for the detection and monitoring of water leakages for water utility systems located in open fields in Cyprus. Two case studies areas were evaluated using freely distributed Landsat 7 ETM+ satellite images and ground spectroradiometric data. In addition, a low altitude system was deployed to observe these pipelines from different heights.
Finally, different remote sensing techniques have been used evaluated as in the detection of leakage from a major water pipe in Cyprus (“Southern Conveyor Project”). Although significant efforts have been made to detect possible water leakages, as shown above, the detection of the water pipe itself it still problematic . This is because such water pipes networks are commonly mapped in a digital form (e.g. GIS environment). However, in most cases the digital location of the water pipe does not fully correspond with the real world, since many obstacles during the construction can be arise and therefore the route of the proposed pipe can change.
In order to explore further the capabilities of remote sensing –beyond the detection of water leakages- the authors have applied several algorithms for the detection of buried water pipes. The detection of buried features is well established procedure in archaeological research since buried anthropogenic remains can be found using remote sensing techniques (Agapiou et al., 2010, 2012b; Sarris et al., 2013). Indeed, soil marks or crop marks related with water pipes can be used, in a similar approach, for mapping the real footprint of a pipe network.
Study areas
In this section, three different case studies are presented. In the first case study, a part of the “Southern Conveyor Project” is described; following, two case studies for the “Lakatameia “ and the “Choirokoitia -Frenaros“ water pipes are presented. In the first case study, the authors have focused to the detection of the actual footprint of the pipe while in the next two case studies, remote sensing techniques have been evaluated for the detection of water leakages. The “Lakatameia“is a pipeline which is currently not in use while the “Choirokoitia -Frenaros“ is a major pipeline of Cyprus where three major leakages have been recorded between 2007 to 2010.
“SOUTHERN CONVEYOR PROJECT”
Water resources development in Cyprus initially focused on groundwater and, until 1970, groundwater was the main source of water supply for both drinking and irrigation purposes. As a result, almost all aquifers were seriously depleted because of over pumping. In addition, seawater intrusion was observed in most of the coastal aquifers. The increase of population as well as the increase in the tourist and industrial activities have led to an increase in the demand for water and have created an acute shortage of potable water.
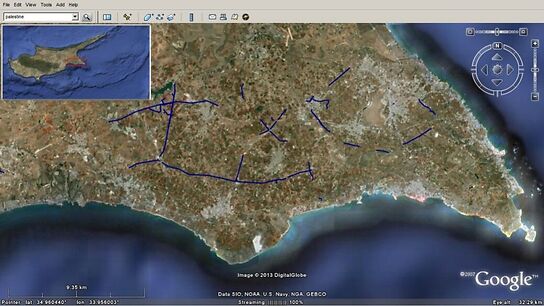
Under these conditions, the implementation of the “Southern Conveyor Project” was a necessity and a basic prerequisite for the further agricultural and economic development of the island. The “Southern Conveyor Project” is the largest water development project ever undertaken by the Government of Cyprus. The basic objective of the project is to collect and store surplus water flowing to the sea and convey it to areas for both domestic water supply and irrigation. Essentially, the project aims to support the agricultural development of the coastal region between Limassol and Famagusta, as well as to meet the domestic water demand of Limassol, Larnaca, Famagusta, Nicosia, and a number of villages. In addition it supports the tourist and industrial demand of the southern, eastern and central areas of the island. The project is able to supply 33 million cubic metres of water for the irrigation of 13 926 hectares and another 33 million cubic metres of water for domestic purposes (Cyprus Water Development Department, 2000). In this case study, a part in the SE of Cyprus was examined (Figure 1).

FIGURE 1.
Map of the SE of Cyprus showing parts of “Southern Conveyor Project” (blue line) (© Google Earth)
“LAKATAMEIA” PIPELINE
An existing pipeline in the area of Lakatameia (central Cyprus) was selected to be used for the pilot study (Figure 2). The existing pipeline, with a length of less than 5 km, has been systematically reported as problematic due to several leakages and is therefore no longer in use by local authorities. The waterpipe runs through both urban and rural areas (see Figure 2). A section of the pipeline with a length of over 2km and located in a rural area, has been used to apply the different remote sensing techniques for the detection of leakages. Since the existing waterpipe is not currently used, it was necessary to fill the pipe with water periodically in order to observe the effectiveness of such remote sensing techniques.
The water pipe is made of UPVC and has 315mm diameter. It is between 1.80m and 2.00m below the ground surface and runs along the Pediaos river for a large part of its length. It is not currently being used due to water leakages occurring throughout almost the entire length of the pipeline. Information regarding the specific dates of the leakages is not available from local authorities.
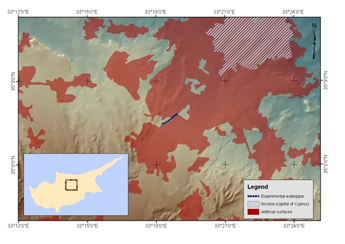
FIGURE 2.
The “Lakatameia” waterpipe (dash line) used as the pilot study area.
“FRENAROS — CHOIROKOITIA” WATER PIPE
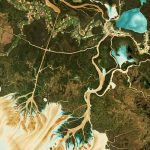
The next area of interest is a major rural pipeline in Cyprus, which runs from the Choirokoitia area to the Frenaros area (Figure 3). The existing pipeline, which passes through the central and central-east part of Cyprus, has a length of over 65 km. The pipeline is located 1-3 meters below ground surface. Various geological formations, including calcaric cambisols, calcaric regosols, and epipetric calcisols exist in the area. elevation of the pipeline (ground surface) varies between 10 m and 200 m above sea level (Figure 4). In addition, the waterpipe passes through different types of land cover, as recorded from the CORINE 2000 land use map (Figure 5).
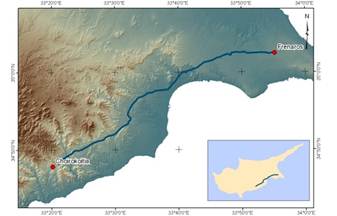
FIGURE 3.
The “Frenaros – Choirokoitia” water pipe (solid line) used as the case study area.
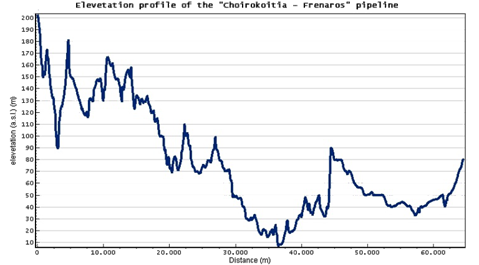
FIGURE 4.
The elevation profile of the “Frenaros – Choirokoitia ” waterpipe.
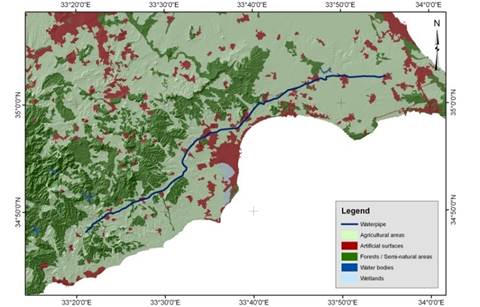
FIGURE 5.
CORINE 2000 land use (Level 1) in the area of interest (”Choirokoitia- Frenaros“ waterpipe)
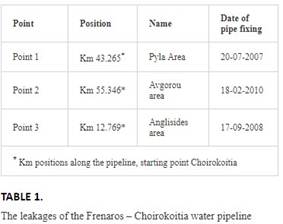
During the period 2007 to 2010, three major leakages were observed along different sections of the pipe (Figure 6). The locations of these leakages were not detected until 2 months after the leakage occurred due to the difficulty of the local authorities in identifying the problematic areas. The leakages occurred during 2007; 2008 and 2010; further details for these events are presented in Table 1.
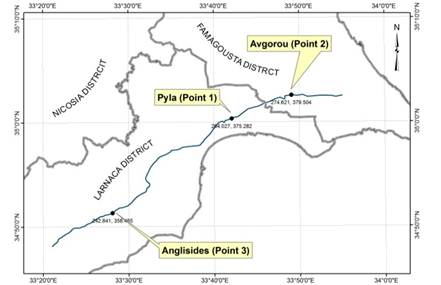
FIGURE 6.
The “Frenaros – Choirokoitia ” waterpipe (in blue). Points 1-3 indicate the three areas were water leakages have been reported.
Methodology
The detection of the footpirnt of the “Southern Conveyor Project” was made based on interpretation techniques. The interpretation was conducted using free data from Google Earth database and using high resolution satellite images. Several histogram enhancement techniques were applied along with filters in order to improve the interpretation. As well, Principal Component Analysis (PCA) and classification techniques were also conducted.
In order to explore the capabilities of remote sensing for the detection of water leakages, two different methodologies were followed. For the “Lakatameia“waterpipe pilot study, ground spectroradiometric measurements were taken using a handheld spectroradiometer. A leakage event was created by filling several sections of the pipeline with water so that ground spectral signatures could be taken before and after the leakage. Spectroradiometric data were also recorded from different heights using a low altitude system. In this way, spectral signatures were able to simulate variation in spatial resolution (pixel size) before any other further application.
For the “Frenaros – Choirokoitia ” water pipe case study, three major leakages have been recorded (see Table 1). Several Landsat 7 ETM+ medium resolution images, showing each leakage before and after the day the leakage was repaired, were used. A geometric and radiometric calibration of the images was performed, following by a multi-temporal analysis of all dataset based on either false composites or vegetation indices.
Resources
In this section, the resources and processing used for each case study are presented. The resources are grouped into three main categories: (a) high resolution satellite data used for the “Southern Conveyor Project” area; (b) spectroradiometric ground data used for the ”Lakatameia“ pipeline and (c) medium resolution satellite data used for the ”Choirokoitia- Frenaros“ pipeline.
HIGH RESOLUTION SATELLITE DATA
IKONOS high resolution satellite images were used for the detection of the buried water pipe. The IKONOS sensor, launched in 1999, was the first high-resolution satellite imagery with a spatial resolution of less than 4m. In addition, free RGB satellite images from the Google Earth database were explored and analyzed (23-10-2003; 13-06-2004; 29-05-2008; 30-05-2009) (Figure 7).
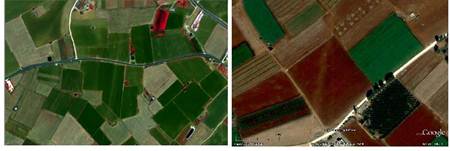
FIGURE 7.
IKONOS satellite image used for the detection of the buried water pipe (left) and free Google Earth images of the area (right).
SPECTRORADIOMETRIC DATA
Spectroradiometric hyperspectral measurements were carried out using the GER 1500 field spectroradiometer (Figure 8a). The GER 1500 spectroradiometer records electromagnetic radiation between 350 nm to 1050 nm (visible and near infrared part of the spectrum) A calibrated Spectralon panel, with ≈100% reflectance, was also used simultaneously to measure the incoming solar radiation. The spectralon panel measurement was used as a reference, while the measurement over the crops as a target. Therefore, reflectance for each measurement can be calculated using the following equation (1):

In order to avoid any errors due to changes in the prevailing atmospheric conditions (Milton et al. 2009), the measurements over the panel and the target were taken within minutes of each other. The coordinates of the measurements were mapped using a Global Navigation Satellite Systems (GNSS) (Figure 8b).
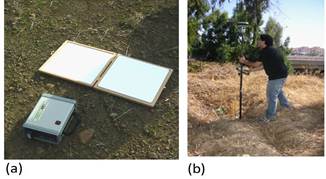
FIGURE 8.
(a): The GER 1500 spectroradiometer used for the collection of ground measurements and (b): the GNSS used for mapping the pipeline
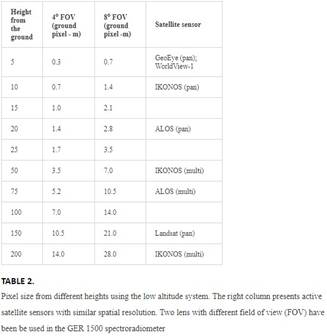
In addition, spectroradiometric measurements were taken from a low altitude system (Figure 9). The spectroradiometer was attached to the air balloon and raised over the pilot study area. Measurements were taken at several heights in the pilot study area and also in the surrounding area in order to compare their spectral signature profiles. As the airborne system was raised, the pixel size in the ground increased. Table 2 presents some characteristic heights where the pixel size corresponds to known satellite sensors.
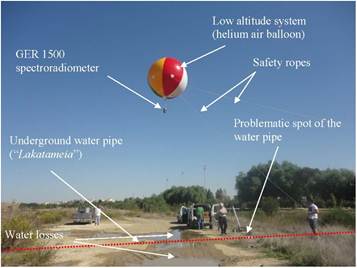
FIGURE 9.
The low altitude system deployed over the leakage in the “Lakatameia“ waterpipe.
Hyperspectral measurements recorded from the GER 1500 instrument needed to be recalculated according to the characteristics of a specific multispectral satellite sensor. The authors modified these data to mimic Landsat 7 ETM+ satellite imagery based on Relative Spectral Response (RSR) filters since such data are freely distributed from the USGS. This data were used for the second case study (“Frenaros – Choirokoitia” waterpipe). RSR filters describe the instrument relative sensitivity to radiance in various parts of the electromagnetic spectrum (Wu et al. 2010). These spectral responses have a value of 0 to 1 and have no units since they are relative to the peak response (Figure 10). Bandpass filters are used in the same way in spectroradiometers in order to transmit a certain wavelength band and block others. The reflectance from the spectroradiometer was calculated based on the wavelength of each sensor and the RSR filter as follows:

Where:
Rband = reflectance at a range of wavelength (e.g. Band 1)
Ri = reflectance at a specific wavelength (e.g R 450 nm)
RSRi = Relative Response value at the specific wavelength
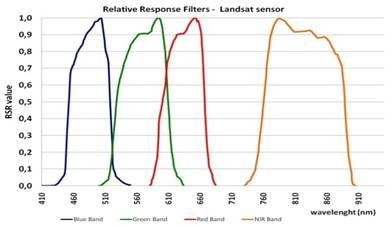
FIGURE 10.
Relative Response filters for Bands 1-4 of Landat TM sensor (Alexakis et al. 2012)
MEDIUM RESOLUTION SATELLITE DATA
Twelve medium resolution Landsat 7 ETM+ satellite images were used, dated before and after the local authorities fixed the leaks on the “Frenaros-Choirokoitia“ pipeline (Figure 11; Table 3). ERDAS Imagine v. 10 software was used for the pre- and post-processing of satellite imagery. Pre-processing included geometric and atmospheric correction correction of the satellite imagery. Geometric correction of the satellite images was conducted using ground control points (GCPs), which included environmental features and ground coordinates. The Darkest Pixel (DP) atmospheric correction method was used, which is the most widely applied method of atmospheric correction that provides reasonable correction (Hadjimitsis et al., 2004; Hadjimitsis et al., 2009).
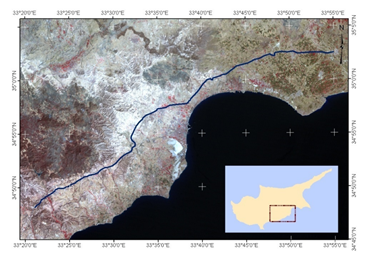
FIGURE 11.
Landsat 7 ETM+ satellite image (28/07/2008) over the ”Choirokoitia- Frenaros“ water pipe.
After the necessary pre-processing steps, several vegetation indices were evaluated. False colour composites were also applied in order to detect the water leakages from the entire dataset. The evaluation was made not only in the three areas of interest (leakage problem) but also along the entire length of the water pipe. The results were mapped and statistical analysis was performed.
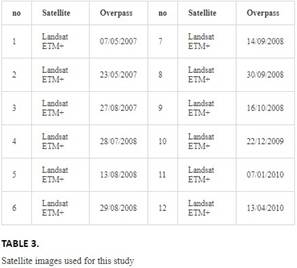
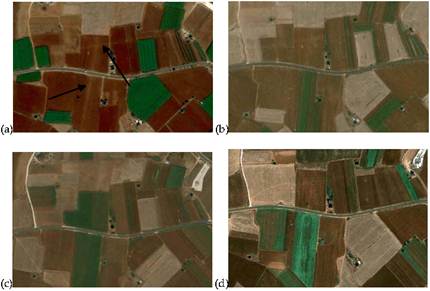
FIGURE 12.
Google Earth satellite image used for the detection of the buried water pipe during different periods: (a): 23-10-2003; (b): 13-06-2004; (c): 29-05-2008; and (d): 30-05-2009.
Results
“SOUTHERN CONVEYOR PROJECT” PIPELINE
The detection of the buried water pipe was initially performed using the multi-temporal Google Earth images (Figure 12). As shown, the success rate for the detection of the water pipe can vary depending on the period of observation. The interpretation could be performed much easier in areas with no coverage (bare soil) while in cultivated areas the interpretation was a difficult task. In addition, images taken just after rainfall or after watering crops, tend to provide better results since soil marks could be easily spotted.
Moreover, the tree pattern could reveal the footprint of the water pipe (see Figure 13). This pattern can be used for the detection of buried water pipes or can be used for monitoring possible problems resulting from tree roots.
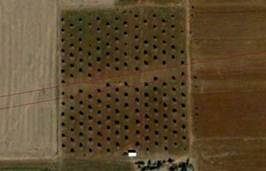
FIGURE 13.
The footprint of the water pipe as a result of the tree pattern.
The IKONOS image used for this case study was able to maximize the visible footprint of the water pipe. Indeed, using the VNIR part of the spectrum and false colour composites (Figure 14) made possible the detection of both soil and crop marks. The IKONOS multispectral image was able to detect other parts of the water pipe network of the area, as shown in Figure 14 (right arrow). Spatial filter and PCA analysis applied to the image data (Figure 15) were able further to enhance the interpretation.
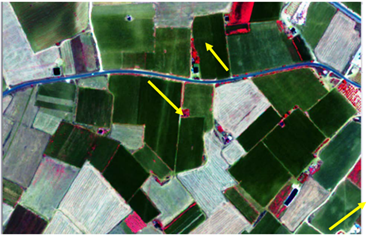
FIGURE 14.
IKONOS VNIR-R-G pseudo colour composite
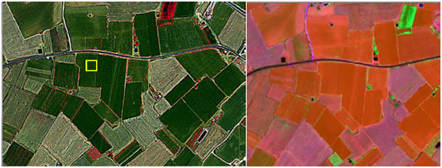
FIGURE 15.
IKONOS 3 x 3 high pass filter (left) and PCA analysis (right)
In an attempt to evaluate if an automatic detection of such crop marks could be performed (e.g. classification), spectral profiles were examined. Spectral signatures from the image were evaluated as shown in Figure 15, which features areas of crop marks and of healthy vegetation. Scatter plots from these two areas (Figure 16) indicate that a spectral difference exists between these areas, especially in the VNIR part of the spectrum.
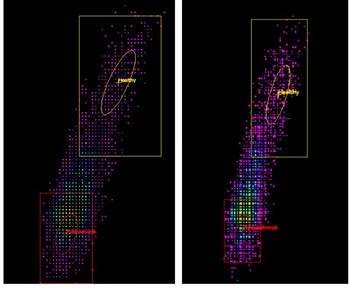
FIGURE 16.
Scatter plots from crop marks (red square) and healthy vegetation (yellow square) for Bands 1-3 and Bands 1-4 combinations (left and right respectively).
“LAKATAMEIA” PIPELINE
The results found that water leakages could be monitored using remote sensing techniques. As shown in Figure 17, the spectral signatures of dry and wet soil is easily recognized in the visible range of the spectrum (400 -700 nm) and in the very near infrared range (750-900nm). Wet soil tends to give 20-25% lower reflectance values compare to the dry soil. This difference is also maximized in the very near infrared range of the spectrum. Similarly, Figure 18 indicates spectral signature profiles of several targets before (dry) and after (wet) a leakage event. Similar findings also applied to vegetation. Dry grass tends to give approximately 5% reflectance in the green part of the spectrum (520-600nm) and 25% in the very near infrared (750-900nm) in contrast to 12% and 35% respectively for the wet grass.
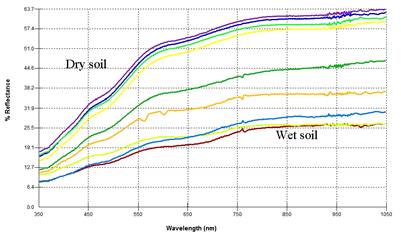
FIGURE 17.
Ground spectral signatures over dry and wet soil in the ’Lakatameia’ pipeline
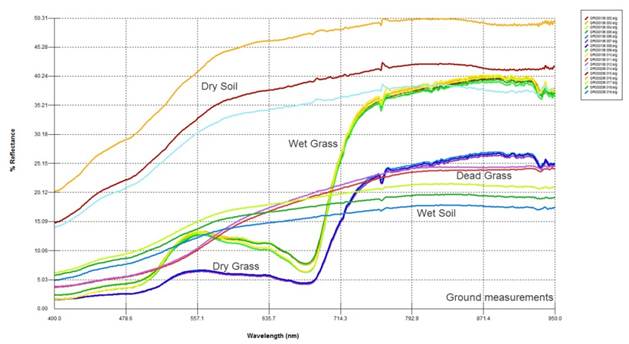
FIGURE 18.
Ground spectral signatures of different targets in the ’Lakatameia’ pipeline
Figures 19 and 20 present the spectral signatures over the same areas from different heights, using the low altitude system. Reflectance initially increases as the system is raised above ground level (until 10 meters) while a small decrease of the reflectance is observed afterwards (16 meters) which can be associated with the larger area covered from the spectroradiometer. However it should be noted that these differences (~5%) are similar to the total relative uncertainties of calibration for satellite sensors (within 5%) (Trishchenko et al. 2002).
The above results are well supported in the literature. Nocita et al. (2011), Ouillon et al. (2002), Dobos (2003), Kaleita et al. (2005) and Garcia-Rodriguez (2011) found that moisture affects the reflectance value of soil. There is a notable decrease in reflectance with increasing moisture in the ground (Bowers and Hanks, 1965; Baumgardner et al., 1985; Twomey et al., 1986; Ishida et al., 1991; Whiting et al., 2000; Bogrekci and Lee, 2005; Lesaignoux et al. 2007). However, the rate of decrease in relative reflectance becomes more moderate with increasing ground moisture, since at very high moisture contents, the soil is already quite dark and further moisture added to the soil has less of an effect on the reflectance (Kaleita et al., 2005). Moisture dominates the spectral reflectance of soils in the 340-2500 nm wavelengths (Somers et al., 2010; Bogrekci and Lee, 2005). Moisture affects the reflection of shortwave radiation from ground surfaces in the visible and near-infrared – VNIR (400-1100nm) and shortwave infrared – SWIR (1100-2500nm) regions of the spectrum (Bowers and Hanks, 1965; Skidmore et al., 1975). It is notable that, although precipitation affects the reflectance value for each target, it does not change the typical spectral signature between wet and dry conditions (Philpot, 2010).
The results indicate that the detection of a leakage event is possible using remote sensing techniques. Indeed, the use of the very near infrared range of the spectrum can be used on areas with bare soil or with vegetation. The findings from this pipeline were therefore compared with data from actual cases studies of water leakage in the ’Freanaros-Choirokoitia’ pipeline.
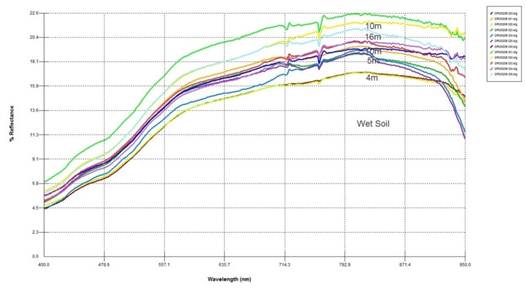
FIGURE 19.
Spectral signatures of wet soil in the ’Lakatameia’ pipeline at different heights using the low altitude system
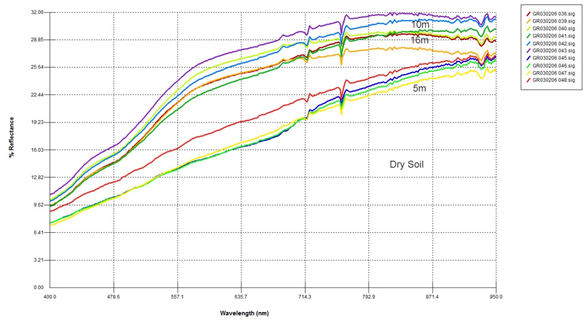
FIGURE 20.
Spectral signatures of dry soil in the ’Lakatameia’ pipeline at different heights using the low altitude system
“FRENAROS — CHOIROKOITIA ” WATER PIPE
Based on the findings of the “Lakatameia” water pipe, satellite images where used for the detection of known water leakages using archive satellite images. In order to examine the capabilities of satellite remote sensing images for the detection of water leakages, several algorithms and analyses were carried out. At first, reflectance values of all datasets (see Table 3) were calculated based on the metadata file using equations 3 and 4. Following this, several vegetation indices were calculated. In addition, different false colour composites were produced to assess the ability of the system to detect the known leakages from the satellite images.
For Point 1 at Pyla area, leakage detection was difficult using medium resolution images. Monitoring of the pipeline using the red and the near infrared part of the spectrum for Point 1 did not reveal any significant changes of reflectance due to the water leakage. Similarly, vegetation indices (NDVI) did not show any differences for Point 3 (Anglisides area).
However, for Point 2, Landsat 7 ETM+, promising results were found. As shown in Figure 21, the Landsat satellite image dated January 7, 2010, tends to give higher vegetation index values, prior to the water leakage being repaired on February 18, 2010. However, the above hypothesis is applicable to other areas of the water pipe as well. The above results have shown the limitations of using medium resolution satellite images for the detection of water leakages, especially when these are rare and small.
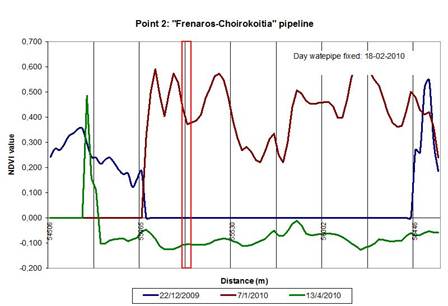
FIGURE 21.
NDVI values using Landsat 7 ETM+ images used over Point 2. The red square highlights the area where the leakage was observed.
In an effort to explore further the information extracted using satellite data the three pilot areas were examined separately. Three vegetation indices, the
Normalized Difference Vegetation Index (NDVI);
Soil Adjusted. Vegetation Index (SAVI) and the
Ratio Vegetation Index (RVI) were calculated based on the formulas shown in equations 5, 6 and 7.
Where:


pNIR is the near infrared reflectance
pred is the red reflectance
Figure 22 presents the NDVI development during the examined 12 dates of satellite overpasses (see Table 3). Figure 23 presents the SAVI development during the examined 12 dates of satellite overpasses.
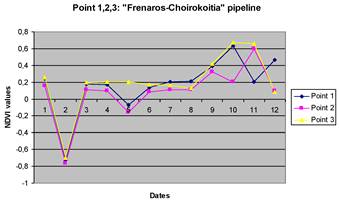
FIGURE 22.
NDVI refl. (calculated with Reflectance values) development during the examined 12 dates (Landsat images) in Points 1, 2 and 3
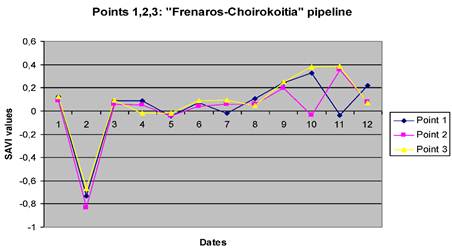
FIGURE 23.
SAVI refl. (calculated with Reflectance values) development during the examined 12 dates (Landsat images) in Points 1, 2 and 3
Based on the graphs of Figure 22, the NDVI values present the following pattern: during May 2007, in all 3 points of the known water leakage, NDVI decreases significantly with values close to -0.8, when almost in all cases NDVI is above zero with similar values. After September 2008, the NDVI values increase until April 2010 when they decline again. Such results indicate that the vegetation of the area around the study points reflects soil moisture resulting from rainfall as it can differentiate according to season. Detailed examination of each point related to the pipeline repair indicates that NDVI in Points 1 and 2, water leakage ceased just after the 2nd and the 11th date in correspondence: (a) Point 1: -0,72 and 0,17 for days 2 and 3 and (b) Point 2: 0,60 and 0,09 for days 11 and 12 respectively.
For Point 1, there is a significant change of NDVI value before and after the repair date of the pipeline. In Point 2, the NDVI value decreased significantly (from 0, 60 to 0, 09) following the repair of the pipeline.
However, in Point 3 there is no significant change of the NDVI value before and after the repair date of the pipeline. Although there is a slight decrease in NDVI values immediately following the repair, there is a significant increase within 2 weeks: Point 3: 0,16; 0,13 and 0,42 for days 7 -9 respectively.
The results indicate that only at Point 2 is there a significant decline of NDVI values as a result of lack of soil moisture around the pipe. Another factor can be that due to the temporal difference between the two measurements, of 7 January 2010 and 13 April 2010, respectively, as lack of rainfall may have resulted in moisture evaporation. The same conclusion is reached with SAVI data (Figure 23). The value of SAVI in Point 2 was 0,35 in January 2010 and declined to 0,07 just after the pipeline repair.
Figure 24 presents RVI data which were calculated using equation 7. The RVI index indicates the effect of soil moisture around Point 2. The RVI value in Point 2, in January 2010 was 4,02 and after the pipeline repair, it decreased to 1,21. It seems that the vegetation developed on the soil around Point 2, and subsequently dried after the repair of the water pipe and the evaporation of the soil water.
In addition, meteorological data provided from the Meteorological Service of Cyprus, indicate that significant rainfall was recorded on 25, 26 and 27 February 2010, after the pipe line repair date of Point 2 (18 February, 2010). During March and April of 2010, only 1.0 and 2.1 mm of rain were recorded for the same location. Such information provides additional validation that the main factor affecting the NDVI, SAVI and RVI values is the presence or absence of vegetation as a result of soil moisture before and after the pipeline leakage repair. Regarding Point 3, in the Anglisides area, September precipitation data did not affect the pipe leakage since no significant rainfall was recorded before and after the pipeline repair (17 September, 2008).
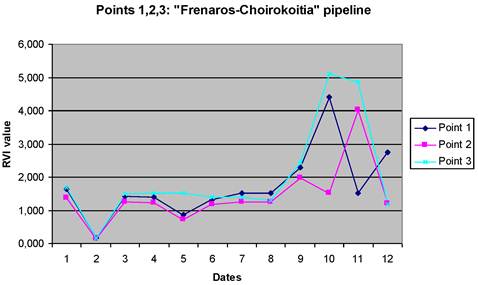
FIGURE 24.
RVI refl. (calculated with Reflectance values) development during the examined 12 dates (Landsat images) in Points 1, 2 and 3
Discussion and remarks
Remote sensing techniques have been found to be effective both for the detection of the water pipes and for the detection of water leakages. The preliminary results of this study have shown that remote sensing techniques are able to detect areas of the pipeline with water leakages. Ground spectroradiometric data along with the low altitude spectroradiometer system indicate significant differences in the reflectance values in areas where leakage is observed. In addition, crop and soil marks can be used for mapping the actual footprint of the water pipe.
Although the use of medium resolution satellite images for monitoring extensive pipelines may be problematic, such as in Points 1 and 3 in the “Franaros – Choirokoitia” pipeline, this may be due to the spatial resolution of the specific satellite images. However, promising results have been also reported (i.e. Point 2 in the “Franaros – Choirokoitia” pipeline), where a major leakage was observed.
In addition, remote sensing techniques can be used on a systematic basis to monitor specific problematic areas of a water network by using time-series satellite images. Future research will investigate additional ground based geophysical methods to provide a competent system for monitoring existing water pipe networks, such as electrical resistance tomography and ground penetrating radar. The resulting data can be integrated into a Geographical Information System which can be used by local authorities.