MAPPING
After completing field work in chain survey and compass survey lot of office work is involved to prepare the plan of the area surveyed. In plane table survey office work is less. The office work involved consist of
1. Applying necessary corrections to measurements
2. Drawing index plan
3. Selecting scale
4. Selecting orientation
5. Drawing network of survey lines
6. Distributing closing error
7. Filling in the details
8. Colouring the map
9. Drawing graphical scale
10. Writing index.
Applying Necessary Corrections to Measurements Necessary tape and chain corrections and corrections for local attraction in case of compass survey, should be applied to the survey lines measured.
Drawing Index Plan
On a rough sheet index plan also known as key plan is drawn. This need not be to the scale but distances and directions of network of survey lines should be approximately to a scale. This plan is necessary to identify the shape of the area to be plotted.
Selecting Scale Depending upon the type of survey, scale should be selected. In general, scale selected should be as large as possible, if a range of scale is recommended. It depends upon the size of the paper as well as largest linear measurement in the field.
Selecting Orientation
Looking at index plan, orientation of map is to be decided so that the map is placed in the middle of the drawing sheet with its larger dimension approximately along the length of paper. North direction is selected and marked. Drawing Network of Survey Lines Studying index map and orientation of paper, first station point of survey is marked. Starting from here one by one survey line is drawn to the scale in its direction. After drawing all survey lines, it is clearly seen whether the selected scale and orientation appropriate. If necessary they may be changed and network of survey lines is redrawn.
Distributing Closing Error
Sometimes in closed traverse, the last point may not coincide with the plotted position of first point. The difference between the plotted position is known as closing error. Before adjusting closing error it is necessary that there are no plotting errors. If it is due to field work error and the error is reasonably small it can be adjusted in the office. If error is large, one has to go back to the field and check doubtful
measurements. In the office closing error is adjusted distributing it suitably to all lines graphically or by mathematical calculation of corrected coordinates of station points. After adjusting closing error network of survey lines are drawn as per the convention.
Filling in the Details
Surveyor has to go through details of one by one survey lines. One by one point of object noted in the field is marked on the drawing sheet by converting the change and offsets to the scale. Main scale and offset scales will be quite useful for this work. After marking the salient points of the objects like building, boundary lines, roads, culvert ends, trees, electric poles etc. the respective lines are joined to
mark the object. The field book will be useful in identifying the objects. If the object is building, the measurements may be only for salient points near the survey lines looking at overall dimensions of the building and scaling down, complete building may be shown in the plan. Thus attending to the field observations of each survey lines all details may be shown. Standard conventions should be used in showing the objects.
Colouring the Map
If coloured maps are to be made, the recommended light washes of standard shades as listed is IS 962- 1989 (Chapter 7) may be applied.
Drawing Graphical Scale
As the drawing sheet may shrink and the measurement taken from shrunk sheet may mislead the distances between any two objects on the map, it is necessary to draw a graphical scale of 150 to 270 mm long just over the space for indexing the drawing, which is right hand side lower corner of the sheet.
Writing Index
Index is the details giving the description of the area plotted, scale used, name of leader of survey party and the person drawing the plan/map. etc. It is normally written in the right hand side lower corner of the drawing sheet. North direction is shown neatly at the right hand side top corner.
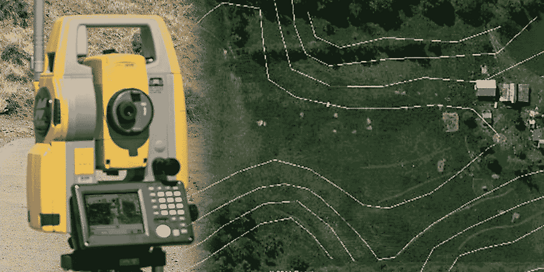
CONTOURS
A contour line is a imaginary line which connects points of equal elevation. Such lines are drawn on the plan of an area after establishing reduced levels of several points in the area. The contour lines in an area are drawn keeping difference in elevation of between two consecutive lines constant Characteristics of Contours
The contours have the following characteristics:
1. Contour lines must close, not necessarily in the limits of the plan.
2. Widely spaced contour indicates flat surface.
3. Closely spaced contour indicates steep ground.
4. Equally spaced contour indicates uniform slope.
5. Irregular contours indicate uneven surface.
6. Approximately concentric closed contours with decreasing values towards centre
indicate a pond.
7. Approximately concentric closed contours with increasing values towards centre indicate hills.
8. Contour lines with U-shape with convexity towards lower ground indicate ridge
9. Contour lines with V-shaped with convexity towards higher ground indicate valley .
10. Contour lines generally do not meet or intersect each other.
11. If contour lines are meeting in some portion, it shows existence of a vertical cliff
12. If contour lines cross each other, it shows existence of overhanging cliffs or a cave
Uses of Contour Maps
Contour maps are extremely useful for various engineering works:
1. A civil engineer studies the contours and finds out the nature of the ground to identify. Suitable site for the project works to be taken up.
2. By drawing the section in the plan, it is possible to find out profile of the ground along that line. It helps in finding out depth of cutting and filling, if formation level of road/railway is decided.
3. Intervisibility of any two points can be found by drawing profile of the ground along that line.
4. The routes of the railway, road, canal or sewer lines can be decided so as to minimize and balance earthworks.
5. Catchment area and hence quantity of water flow at any point of nalla or river can be found. This study is very important in locating bunds, dams and also to find out flood levels.
6. From the contours, it is possible to determine the capacity of a reservoir.