City busses are main vehicles for public transport to meet travel demand of the society. They operate where urban population is very dense and release such emissions as particulate matters (PM), nitrogen oxides (NOx), carbon monoxides (CO), and hydrocarbons (HC) where the population lives (Soylu et al., 2009, Gumrukcuoglu et al., 2008, Soylu, 2007, WHO, 2003). Unfortunately, concentrations of the released emissions are generally high enough to damage human health and there is no enough time for the emissions to be diluted in the air to harmless concentrations before they are inhaled by human receptors. It is well known from the literature that exposure to even relatively low concentrations of vehicle emissions exacerbates or provokes many diseases (WHO, 2005a, WHO, 2005b). Adverse health effects of the emissions have been known for many decades and in order to prevent these effects many strict legislations, which reduces the limits more than 90% over four decades, for vehicle emissions have been issued. However, urban populations in many developed countries are still suffering from urban transport sourced emissions (Duclaux, 2002, Colvile et al.,2001, Frey et al., 2009, Erlandsson et al., 2008). One of the important reasons for this is that the engine certification test cycles don’t represent the real world in-use operation of the vehicles and, hence, quantity of vehicle emissions to be released in the urban streets has not been reduced in parallel with the stringent emission legislations (Cocker et al., 2004, Lents et al., 2007).
City buses generally use diesel engines as power source and emit carbon dioxide (CO2), water vapor (H2O), and nitrogen (N2) to the ambient air as the main products of engine combustion. The quantity of CO2, which is the major greenhouse gas (GHG), is proportional to the fuel used in transport activities and it is inevitable combustion product, however, it is not necessary to emit CO, HC, NOx, and PM, which are generally called local pollutants since they are more harmful where they are emitted. The emissions of the local pollutants from city busses depend strongly on engine combustion technology, exhaust after-treatment devices, fuel quality, vehicle aging, and operating conditions (Cocker et al., 2004, Lents et al., 2007, Regulation, 2009). Especially the bus operating conditions may have significant effects on the emissions. Depending on city traffic and road conditions which involves many short trips with frequent accelerations, decelerations, low rush hour speeds and various road grades, the emissions may change with an order of magnitude (Cocker et al., 2004). Urban transport operating conditions and especially the city bus operating conditions are quite specific for a particular city and, hence, the well known certification test cycles cannot represent accurately these conditions all over the world. For this reason EURO VI regulation
Source: Urban Transport and Hybrid Vehicles, Book edited by: Seref Soylu,
ISBN 978-953-307-100-8, pp. 192, September 2010, Sciyo, Croatia, downloaded from SCIYO.COM
for heavy duty vehicles requires application of portable emissions measurement systems (PEMS) for verifying the real world in-use and off-cycle emissions (Johnson et al., 2009). PEMS are remedy for the real world emission measurement as they can be installed quickly to the vehicle and measure in-use emissions. There are varieties of PEMS available on the market to measure both gaseous and PM emissions (Lents et al., 2007, Durbin et al., 2007). Some of them have minor differences in measurement theory and technique that may require standardization of PEMS themselves in the future (Younglove et al., 2005). With PEMS and their auxiliary systems it is possible to examine the impacts of road and traffic conditions on the performance of the vehicle, the engine, the after-treatment system, and the exhaust emissions. Therefore, it is possible to optimize a vehicle in terms of fuel consumption and emissions for a specific route by using PEMS. Besides real world emission performance of advanced technology vehicles such as hybrid vehicles should be tested by using PEMS since they have an electrical drive unit, also. It is crucial for the automotive industry as manufacturers and the municipalities as end-users to choose the most suitable vehicle for the specific transport route to minimize the capital cost, the fuel consumption, and the emissions.
In this sense the PEMS are one of the most useful equipments to meet this need.
PEMS are also very useful in quantification of transport sourced emissions. Since the emissions factors can be determined under real world conditions, determination of the effects of transport sourced emission on the global air quality as required by EURO VI can be much more accurate (Johnson et al., 2009). There have been various research work published in the literature to examine real-world emission of the vehicles to develop emission factors and prepare inventory for a vehicle class (Durbin et al., 2007, Younglove et al., 2005, Durbin et al., 2008, CFR Part 86, 2008). The US EPA and EC JRC have made significant effort for development of proper methodologies for the real-world in-use emission measurement as a part of transport emission regulations (Soylu et al., 2009, Southwest Research Institute Report, 2008). The US EPA together with CARB, SENSORS Inc. and Caterpillar Inc. initiated a programme to develop a mobile emissions laboratory (MEL), which is compliant with code of federal registration (CFR) 1065, to compare and validate accuracy of PEMS under different inuse driving conditions (Lents et al., 2007, Durbin et al., 2007, CFR Part 86, 2008, Southwest Research Institute Report, 2008). At the conclusion of this programme the final measurement allowance value for NOx emissions determined to be as high as 4.5%.
Swedish Road Administration was also carried out a PEMS programme to test in use performance of heavy-duty vehicles under real world conditions (Cocker et al., 2004). In this programme three city busses (which are Euro IV/V level) were equipped with PEMS and tested on a reference route which comprises urban, rural and highway driving with an average speed of approximately 60 km/h and on an actual bus route. It was observed that on the actual bus route, high level transient operation of the city busses have significant adverse effects on the performance of exhaust after-treatment system. Especially the NOx emissions were increased almost up to an order of magnitude when compared to that of the reference route. In Turkey, a similar research project has been introduced by Sakarya University with support of Turkish Ministry of Industry and TEMSA R&D, to quantify impacts of hybridization on city bus emissions and fuel consumption under real world in-use conditions (Soylu, 2009). In order to quantify the impacts, a two-phase test programme was prepared to measure real world in-use emissions and fuel consumptions of both conventional and hybrid city busses on a specific bus route in Sakarya city center. In the present work the results from the first phase of the test programme that involves examination of the effects of road and traffic conditions on conventional bus operating characteristics and the response of bus engine and selective catalytic reduction (SCR) system to these characteristics in terms of NOx emission were presented.
Experimental procedures
In this work all the tests were carried out on the “university route” of Sakarya Municipality city busses. The route includes a round trip between Sakarya University and the city center which represents typical Sakarya urban driving. It is 22 km long and involves 48 bus stops and the altitude changes from 30 m to 220 m. The travel time is approximately 60 minutes. During the test the vehicle was driven on the route with and without its SCR system and data for vehicle speed and location, engine operation characteristics, exhaust flow-rate, exhaust emissions and environmental conditions were sampled second by second. The test measurements were made by using a SEMTECH DS from SENSORS inc. This system includes a flame ionization detector (FID) for total HC measurement, a non-dispersive infrared (NDIR) sensor for CO and CO2 measurement, a non-dispersive ultra violet (NDUV) sensor for NO and NO2 measurement. The NDUV measurement is different from standard chemiluminescence measurement that is used for the reference method. Exhaust mass flowrate was measured by using SEMTECH EFM which operates based on pitot tube technology. Before the test the PEMS was warmed up according to recommended operating conditions and then, zero, span and audit calibrations were completed to ensure the accuracy.
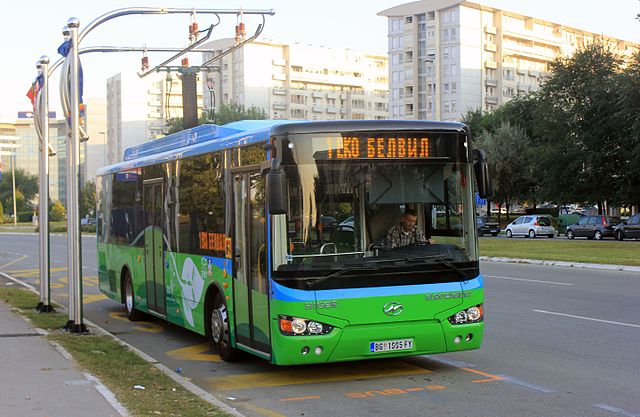
The test vehicle was TEMSA AVENUE which is a 12 m long city bus. It is powered with a 6.7 liter engine CUMMINS ISB EURO 4 (model year 2005) engine which produces 250 HP at 2500 rpm. The engine was certified to 3.5 g/kWh NOx standard. Over the test the ambient temperature varied from 25 to 30 ˚C and the relative humidity varied from 30 to 45 % which are typical for summer time.
Results
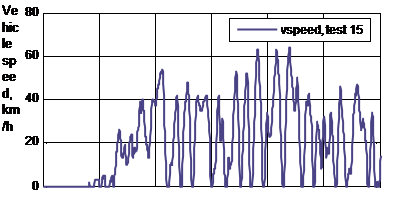
Figure 1 indicates a speed profile for the specific test route, which is a real world city bus speed profile. Highly transient behavior of the route can be seen clearly from the figure. The vehicle speed reaches to as high as 65 km/h but there are many stops with corresponding decelerations and accelerations because of the road traffic and bus stops. It is well known from literature that vehicle speed profile has a strong impact on operating characteristics of the vehicle engine. Figure 2 indicates the effects of the real world drive characteristics on the engine map in terms of the number of occurrences (frequency) corresponding to engine loads and speeds. As can be seen from the figure, under the real world drive conditions the engine operates most of the time at loads less than 60% and low speed conditions. Figures 3 and 4 indicate engine load-speed map for European Transient Cycle (ETC) that is current regulatory test cycle for heavy duty engines and World Harmonized Transient Cycle (WHTC) which is expected to be valid certification cycle for heavy-duty engines with EURO 6 regulation. As can be seen from the figures in these cycles the engine operates mostly at speeds between 1200 and 1500 rpm and at loads less than 50% except for ETC which also operates frequently at loads higher than 90% as well. From these maps it is easy to see that the certification test cycles don’t correlate very well with the real world city bus driving conditions although city bus engines are still certified according to ETC. WHTC operates more on the low speed conditions but, the frequencies on the load-speed map are still significantly different from that of the real world city bus driving conditions. It is therefore questionable if the certification cycle emissions limits ever be realized in the real world driving conditions. A certification test cycle should be able represent real world operating conditions of an engine, however there are different type of use of these engines such as highway trucks and busses, delivery trucks, and city busses. Engines of these different vehicle classes will certainly operate with different frequencies on the engine load-speed map although they all are certified with the same test cycle. Therefore, off-cycle operation of these engines and corresponding emissions can be significantly higher than that of the certification test cycle. In order to minimize these off-cycle emissions, EPA introduced Not To Exceed (NTE) regulations but there is almost no way to completely control engine emissions when considering sophistications at engines and their after-treatment systems.
0 200 400 600 800 1000 1200 Time, seconds
Fig. 1. Variation of the vehicle speed on the specific bus route
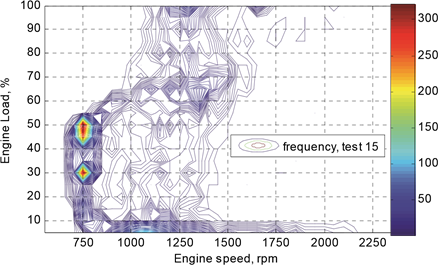
Fig. 2. Engine load-speed map for real world driving.
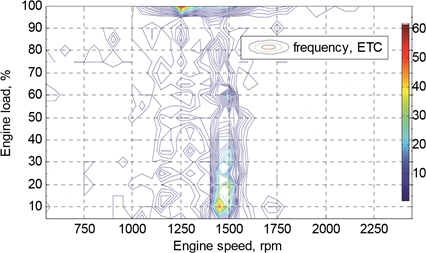
Fig. 3. Engine load-speed map for ETC
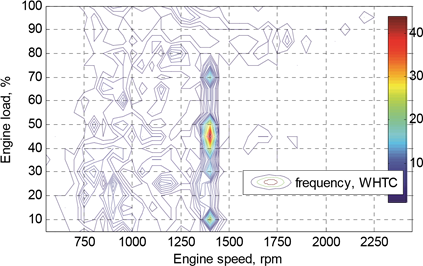
Fig. 4. Engine load-speed map for WHTC (to be valid with EURO 6)
As mentioned earlier, vehicle emissions are strongly dependent on engine operating conditions. Especially NOx emission formation is almost directly increase with the engine load since the formation is dependent strongly on combustion temperature and the available oxygen. As can be seen from Figure 5a and 5b, there are two common strategies to minimize NOx emissions. First approach is the exhaust gas recirculation (EGR) which minimizes NOx formation in the engine by lowering the oxygen concentration and maximum combustion
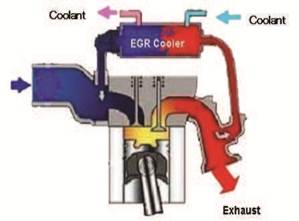
Fig. 5a. EGR strategy to minimize NOx emissions (TRAD, 2010).
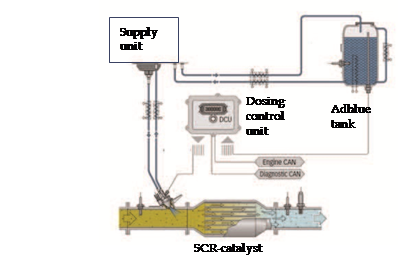
Fig. 5b. SCR strategy to minimize NOx emissions (VALTRA, 2010).
temperature. However, this approach may have an adverse effect on PM emissions and the fuel consumptions. The second approach is selective catalytic reduction (SCR) of NOx emissions which requires a catalyst and aqueous urea solution on the vehicle. Once the urea solution is injected to hot exhaust gases, NH3 is formed from the injected urea by means of hydrolysis. Then NOx emissions are minimized in the catalyst after its chemical reaction with the NH3 to form nitrogen and water. SCR of NOx emissions doesn’t have any adverse effect on fuel consumption and PM emission since the engines can be tuned for maximum thermal efficiency. However, there are a few other concerns with this approach. First of all, freezing temperature of the urea solution is quite high, which is -11 ˚C, and this may cause technical problems during winter time (Koebl, 2000). The second is that high values of NH3 slip may result if the stoichiometric ratio of NOx to NH3 cannot be provided. The main difficulty with this stoichiometry is that engine load and speed are not steady and hence the concentration of NOx emissions in the exhaust. Therefore establishing the stoichiometry is mostly dependent on precision of the urea injection control system. The third concern with SCR system is that it is temperature dependent. In order to reduce the NOx emissions efficiently, the exhaust gas temperature in the SCR system must be higher than 250 ˚C. Therefore, the reduction of NOx with SCR system is highly dependent on engine operating conditions and, hence, vehicle driving conditions.
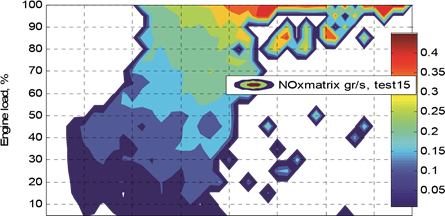
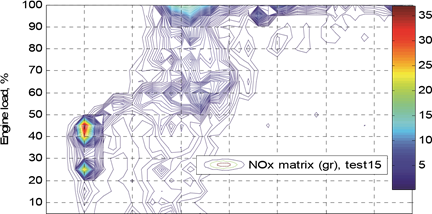
Figure 6 indicates exhaust gas temperature distribution over the engine load-speed map for the specific bus route. As can be seen from the figure, the temperature is generally around 250 ˚C over the entire map although there is a tendency that the temperature rises up through higher loads and speeds. Figure 7 indicates NOx emissions in grams per second to be released over the engine load-speed map corresponding to the same bus route. As can be seen from the figure, the NOx emissions increase with the higher speeds and loads because of the higher combustion temperatures and higher exhaust flow-rates associated with it. Figure 8 indicates the distribution of the total NOx emissions to be released in grams over entire trip. As can be seen from the figure during this trip most of the NOx emissions were released at a location on the map where load is about to 45% and speed is about to 750 rpm, which are quite low. This seems to be surprising, because as was given in Figure 7, the NOx emissions in terms of grams per second was increasing with higher loads and speeds. However, as was given in Figure 2 during the entire trip the engine operating frequency at 45% load and 750 rpm speed was shown about 300 that is one of the most visited locations. For this reason the total NOx emissions to be released during entire trip is highest at this location. This location probably corresponds to the city bus idling and first acceleration, which is visited during every bus stop, for this reason this location is visited most during the entire trip.
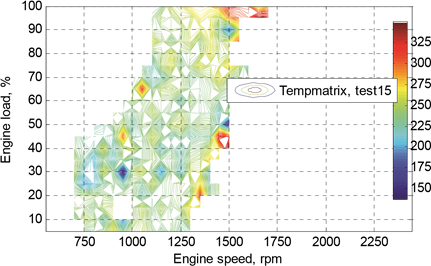
Fig. 6. Exhaust gas temperature distribution (˚C) over engine speed – load map (Temperature measured from exhaust flow meter).
750 1000 1250 1500 1750 2000 2250
Engine speed, rpm
Fig. 7. NOx emissions to be released over engine load-speed map without SCR system
750 1000 1250 1500 1750 2000 2250
Engine speed, rpm
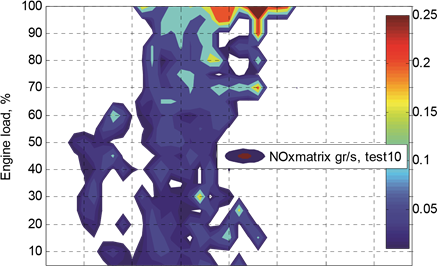
Fig. 8. Cycle NOx emissions to be released over engine load-speed map without SCR system Figure 9 indicates another trip on the same route while SCR system of the city bus is active. As can be seen from the figure, NOx emissions to be released over the entire map are much less than that of the trip without SCR system, which is Figure 7. NOx emissions are efficiently reduced exceptions for a few hot spots. Besides, there is no step wise increase in NOx emissions with increasing load and speed exception for loads higher than 90%. At this load and speed the exhaust mass flow-rate is probably so high that the NOx emissions in grams per second are still significant. Figure 10 indicates the total NOx emissions to be released for the entire trip while SCR system is active. As can be seen from the figure the
750 1000 1250 1500 1750 2000 2250
Engine speed, rpm
Fig. 9. NOx emissions to be released over engine load-speed map with SCR system.
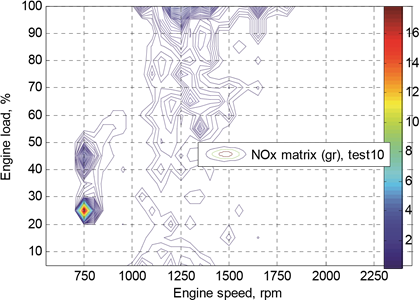
Fig. 10. Cycle NOx emissions to be released over engine load-speed map with SCR system. most of the NOx emissions are released at 25% load and 750 rpm speed. This location is the idling location and as was given in Figure 2, it is one of the most visited locations during the entire trip on this route. For this reason, the total NOx emissions to be released during the entire trip are highest at this location.
These figures indicates that city busses that operate in the bus routes are generally operating at low loads and speeds and most of the trip emissions are corresponding to these locations on the map.
Conclusions
It was observed that real world driving characteristics of the city bus don’t correlate well with that of the ETC, which is the certification cycle for the city bus engines. For this reason it is not realistic to expect emission levels lower than corresponding EURO standards from the city bus during real world driving. City bus NOx emissions in terms of grams per second are increasing with engine load and speed but the total NOx emissions for entire trip are the maximum at the locations where engine visited most, which are low speed and load conditions. Therefore, while optimizing the city buses for the best fuel economy and emissions, the real world drive characteristics of the city bus and the corresponding operating conditions of the engine and after-treatment system must be considered.