
Monitoring the actual state and tendencies of urban air quality and its forecasting plays an important role in the environmental and meteorological research of Hungary, since it is a key element of the urban life quality and health protection. After the change of the political system in 1990, with the modernization of the industry, road traffic became the most important pollution source: for example, the contribution of road traffic to the total air pollution in large and medium cities such as Budapest and Szeged is between 70 and 80%. Similarly to the common prediction of environmental and meteorological parameters, their measurements also constitute a closed system (Baklanov, 2006; Baklanov et al., 2006; Bozó et al., 2006a,b). The importance of regional and urban scale studies, environmental plans, impact assessments, statistical and dynamical modelling of air pollution and prediction of hazardous meteorological situations have grown significantly beside large- and meso-scale air quality modelling.
The University of Szeged established its importance in the research of the urban heat island and the discovery of relations between meteorological parameters and air pollution (Makra et al., 2006a; 2006b; Unger & Pongrácz, 2008). In the scale dependent modelling of dispersion the Hungarian Meteorological Service, the Department of Meteorology at Eötvös Loránd University and the Department of Fluid Mechanics at Budapest University of Technology and Economics are the most important institutes (Steib & Labancz, 2005; Lovas et al., 2006; Steib et al., 2008; Balczó et al., 2009).
Following the review of air quality research in Hungary, we introduce the national pollution monitoring network; afterwards we deal with the opportunity of urban air quality modelling. The correlation between urban air quality and the large-scale weather situations (macrocirculation patterns) in long term trends of the most important pollutants and road traffic emissions will be demonstrated through the example of Szeged.
The city of Szeged (20°06′ E; 46°15′ N) is the largest town in southeast Hungary, and located at the confluence of the rivers Tisza and Maros. The built-up area covers a region of about 46 km2 with 155,000 inhabitants. The major part of air pollution occurs in the urban area as a consequence of road traffic and heating (ca. 70% of dust is emitted on the roads). The
Source: Urban Transport and Hybrid Vehicles, Book edited by: Seref Soylu,
ISBN 978-953-307-100-8, pp. 192, September 2010, Sciyo, Croatia, downloaded from SCIYO.COM
amount of pollutants emitted by industry or advected by continental or regional transport has been less significant. Traffic data includes traffic census, speed and vehicular emission data, while the meteorological data consists of (i) daily macrocirculation patterns, (ii) synoptic, road and urban meteorology data. The effects of traffic emissions on the ambient air quality in Szeged were evaluated using the CALINE4 and the CAR urban air pollution models. Both models are Gaussian type dispersion models specifically designed for the evaluation of air quality impacts of roadway projects. Each roadway link is treated as a separate emission source, producing a plume of pollutants which disperses downwind. Air pollution concentrations at any specific location are calculated using the total contribution from the overlapping pollution plumes originating from the sequence of roadway links. Both models had been run on realistic input parameters, regional and city background concentrations. Street geometry and traffic data for the period 1997–2008 at Szeged have been used. The annual mean concentrations on some major roads of the Szeged region clearly indicate the increase of CO levels and a much more definite increase of NO2 concentrations between the beginning and end of the period examined. Model results have been compared to measurements showing good agreement with (i) slight overestimation of concentration due to the insufficient consideration of technological development of vehicles using the CAR model; (ii) remarkably higher vehicle-originated air pollution, as clearly indicated by the CALINE4 dispersion model.
Urban and rural air quality research: a historical overview
The atmospheric chemistry research and studies of urban air quality have a history of about one and a half century. The Institute of Public Health in Budapest was established by József Fodor in 1874. Similarly to the program of the French observatory in Montsouris, besides dust, measurement has been done for the assessment of carbon-dioxide, ozone and ammonia. Till the end of the 1930s, due to industrial activity and heating mostly based on burning brown coal with a high sulphur content, sulphur-dioxide became the most important pollutant, with mean annual concentrations higher than 2000 μg m–3 in the most polluted parts of the capital which decreased to 900 μg m–3 for industrial regions and 240 μg m–3 for the whole area of Budapest in the first part of the 1960s (Mórik, 1970). The annual concentrations of SO2 for Budapest and Szeged were 4.9 μg m–3 and 6.3 μg m–3, respectively, in 2009. This was the result of changing the system of heating and the structure of industry. The urban air quality monitoring system had been established by the end of the 1970s. Nowadays, pollutants of road traffic (e.g.: NOx, CO) have become dominant, but the dust and soot for Budapest and the dust for Szeged are also significant loads.
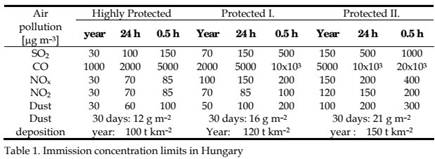
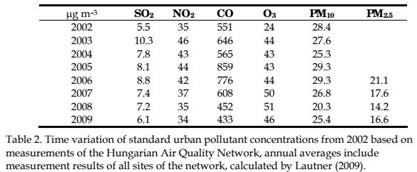
The immission thresholds for the most important pollutants are presented in Table 1. The fact that Szeged has been pushed into the list of clean air cities, compared to other Hungarian towns with heavy industries in the second half of the 20th century, shows the change in the structure of industry and road traffic. Time variation of standard urban pollutant concentrations from 2002 based on measurements of the Hungarian Air Quality Network using data from all stations are shown in Table 2. No significant trend can be detected in the trace gas concentrations. The amounts of PM10 and PM2.5 are slightly decreased.
Background air quality measurement and modelling are also the scope of meteorology. One of the most important trace gases is ozone. Historical ozone data sets are available from the mid 1800s for Buda and Szeged. The first attempts in atmospheric chemistry and atmospheric physics were made at the Main Meteorological and Geomagnetic Observatory established in 1867 at Ó-Gyalla (today Hurbanovo, Slovakia). The almanacs of the observatory contained ozone measurements beside meteorological and geomagnetic data between 1893 and 1905 for day- and night-time on the 10-degree Schönbein scale.
The chemical measurements of precipitation were initiated at the beginning of the 20th century. Comparing to data from the 1980s, Horváth (1983) pointed out that the anthropogenic emission of NOx, (burning of fossil fuels, emission from vehicles) had been markedly increasing since the beginning of the 20th century. The nitrate concentration measured in 1902 (0.13 mg N litre–1 in the precipitation) was only 15% of the level of the early 1980s (0.86 mg N litre–1). This value has been measured to be about 2.42 mg N litre–1 (at station K-puszta, Fig. 1) in 2009, a large increase.
Regular precipitation chemistry measurements were only initiated in 1965. The background concentrations of sulphur-dioxide and nitrogen-oxides have been measured since 1973. Currently, several background atmospheric precipitation chemistry and/or atmospheric pollution stations (Fig. 1) have been operating in Hungary (Haszpra et al, 2006; Weidinger et al., 2010). Only one of them, located at K-puszta, has an overall importance: it has been sending precipitation chemistry, trace gas, aerosol and heavy metal concentration measurement data to the EMEP (European Monitoring and Evaluation Programme) centre since its establishment in 1974 (Müller et al., 2007; Haszpra, 2008; Strategy for EMEP 2000– 2009). This station also yields background concentration data to the air quality measurements in Szeged.
Regulatory air pollution modelling has been carried out in Hungary since the early 1960s. Initially Gaussian puff models were used, in which stability categories and boundary layer depths were calculated. For the uniform application of transmission schemes the standardization of air quality models is crucial. This work ended in the early 1980s, when pollution of point, line and aerial sources were modelled. These models can be applied even in urban environments (Fekete et al., 1983; Gyöngyösi et al., 2009). The next step was the development of the Hungarian Standardized Model in the 1990s (HNS-TRANSMISSION). This Gaussian transmission model can consider contribution of up to 50 sources. It is suitable to describe transmission processes from local to regional scales including the effect of orography (Szepesi et al., 2005).
The EPA AERMOD system has been implemented at the Hungarian Meteorological Service as a powerful tool for case study calculations (Steib, 2005). The development of a meteorological pre-processor for the model has also been performed. Several dispersion models have been applied in the urban environment in Hungary, such as ADAMS, AURORA, CAR, CALINE4, ISC3, MISCAM, among others, but even wind tunnel experiments have been performed and the FLUENT numerical solver has also been applied for urban air pollution research purposes. Several models of industrial accident risk assessment have been run. Input data for these models are yielded by the prediction system of the Hungarian Meteorological Service from the ALADIN and MM5 model outputs and the forecast datasets of the ECMWF centre (Hanna et al., 2001; Havasi & Zlatev, 2002; Moussiopoulos et al., 2003; Mensink et al., 2008; Kristóf et al., 2009; Mészáros et al., 2010). WRF, earlier the ETA numerical weather prediction model systems are also used for air pollution modelling purposes (Weidinger et al., 2006).
Measurements of rural and urban air quality constitute a uniform system with meteorological information. The Hungarian Meteorological Service provides a complex database for rural and urban environmental and standard meteorological measurements. This job is performed by the Air Quality Reference Centre, which was established in 2009.
The air pollution monitoring system in Hungary
Currently, the existing network in Hungary comprises 37 fully automatic monitoring stations for which the Hungarian Meteorological Service (http://www.kvvm.hu/olm/) is responsible (data has been available since 1974). Station locations are shown in Fig. 1. Stations monitor air pollutants as well as meteorological parameters and are connected to a central automatic collection and processing unit. The monitoring network is operated, managed and maintained exclusively by the Hungarian Meteorological Service. All data collection, processing and maintenance operations are performed by the Hungarian Air Quality Network’s (HAQN) officials and technical personnel. They are responsible for issuing short term emergency bulletins on days of high pollution levels and imposing various restrictive measures to limit the magnitude of pollution episodes. Long-term strategic policy planning and implementation of permanent measures are also the responsibility of HAQN. The assessment of air quality is based upon monitoring and modelling at different temporal and spatial scales for regulated components in Europe: PM10 (and PM2.5), NO, NOX, NO2, CO, SO2, O3 and benzene. With manual sampling method at 199 measuring points SO2 and NO2 measurements are carried out daily and collected weekly. At 296 measuring points, dust deposition is detected on a monthly basis.
Fig. 1. Monitoring network of regional background air pollution (blue dots) and urban monitoring sites (red dots) in Hungary
The variation of air pollution in terms of ozone concentration in the past century and a half
Ozone, one of the most important trace gases in the atmosphere, was discovered by Christian Friedrich Schönbein (1799–1886) Professor of Chemistry at the University of Basel. It is a secondary pollutant, which means that it does not have direct sources near the surface. The level of ozone concentration was about 5 to 15 ppb (10 to 30 μg m–3) in the second half of the 19th century with a weak daily and annual variation. As a result of anthropogenic effects (caused mainly by road traffic), concentration values have since increased to double or triple that. Ozone is harmful to living tissues even at low concentrations. Humans have become adapted to this load (Möller, 1999), but its very high current concentration can no longer be tolerated.
Ozone is generated by photochemical reactions of anthropogenic pollutants (eg. NO, NO2, CO, VOC) and natural organic compounds (isoprene). Another important source for tropospheric ozone is the down-mixing of stratospheric ozone during tropopause folding events. The near surface ozone concentration has a typical annual and daily variation. Its annual variation can be characterized by a summer maximum and winter minimum. A secondary maximum can occur during early spring due to the down-mixing of stratospheric ozone. The highest near surface concentrations may occur in the afternoon and early night hours.
Let us now consider historical measurements (Fig. 2). Measurements of atmospheric ozone were made using Schönbein’s method at more than 20 stations in the Habsburg Empire in the period 1853–1856, which resulted in the most detailed database ever made, in which
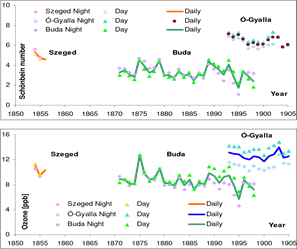
Fig. 2. Annual mean Schönbein numbers (top) and ozone concentrations (1 ppb ~ 2 μg m–3) at Szeged, Ó-Gyalla (presently in Slovakia: Hurbanovo) and Buda (bottom), respectively, for the period 1854–1905 (day-time, night-time and daily mean values)
meteorological data are presented together with Schönbein numbers. In the territory of the Hungarian Kingdom ozone measurements were performed, inter alia, in Buda (its German name in the database: Ofen), Szeged (Szegedin), Selmecbánya (Schemnitz) and Besztercebánya (Neusohl). Long-term datasets from Buda (1871–1898) and Ó-Gyalla (1898– 1905) are also available in the archives of the Hungarian Meteorological Service and in the library of the Faculty of Science, Eötvös Loránd University (Weidinger et al., 2009). Ozone concentration has been determined following Pavelin et al., (1999), based on day-time and night-time Schönbein numbers and relative humidity data.
Our results for Szeged, Buda and Ó-Gyalla, including annual average Schönbein numbers and ozone concentrations between the middle of the 19th century and the beginning of the 20th century are presented in Fig. 2. The highest Schönbein number values and ozone concentrations were obtained for Ó-Gyalla and the lowest ones for Buda. There is a slight
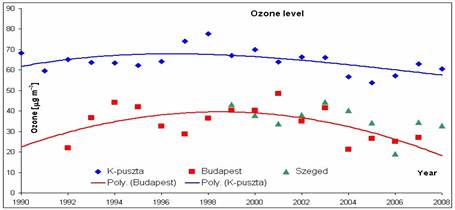
Fig. 3. Annual mean ozone concentration in Budapest and Szeged (both urban) and K-puszta (rural) stations, 1990–2008
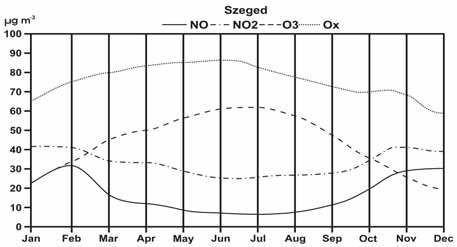
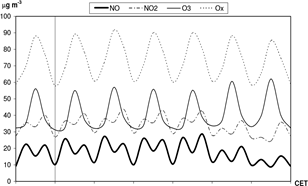
Fig. 4. Time variation of the annual mean concentration of NO, NOx, O3 and Ox, respectively, at Szeged between 1997 and 2001 (Kiss et al., 2005) difference between the values measured at Buda and those measured at Szeged. No significant trend can be found in the data series at Buda, but the population and correspondingly economic potential of Budapest (after incorporating cities Óbuda, Buda and Pest in 1873, the name of the capital became Budapest) grew dramatically. Simultaneous measurements at Buda and Ó-Gyalla represent the difference between rural and urban environmental conditions. The course of annual means indicates an inter-annual variation of about 8–12 ppb (16–24 μg m–3) at Szeged and Buda, and about 12–14 ppb (24–28 μg m–3) at Ó-Gyalla. Ozone concentrations have been measured to be higher in the day-time and lower at night. The difference between day-time and night-time data is lowest in Szeged, and the highest (especially at the end of the considered period) in Buda and Ó-Gyalla, which can be explained by the effect of urbanization.
It is also obvious that values measured in Ó-Gyalla are higher than those in Buda within the same period. This highlights a phenomenon that has been experienced even today: in the clean air of remote sites, far from industrial pollution sources, higher ozone concentrations can be recorded due to the different vegetation. After performing a more detailed analysis of the data series from Buda, the day-time concentrations in spring and summer turned out to be usually higher than those at night, which shows the effect of photochemical processes. In autumn and winter, however, days with higher nocturnal concentration occur more frequently. A possible explanation is lower insolation, the effect of vegetation and coal heating.
Comparing historical data to current measurements, the trend of the difference in the urbanrural ozone concentration is becoming larger and larger; furthermore, an ever increasing difference can be observed between day-time and night-time concentrations as well. The role of photochemical processes has become more pronounced with the increase of the emission of nitrogen-oxides and other trace gases that are important in ozone generation (Bozó et al., 2006b). Daily variations are also increasing.
The annual mean concentrations between 1990 and 2008 at Budapest, Szeged and K-puszta are shown in Fig. 3. Note that until 1998 the tendency was positive, while since 1999 concentrations have been decreasing at all three stations. The data of Szeged fit the values of Budapest (urban stations). Current measurements indicate almost three times higher ozone concentrations compared to those in the 19th century.
Anthropogenic effects and the increased photochemical processes exert substantial influence on the monthly values of O3, NO, NOx, Ox, respectively (Fig. 4). The primary reason for the growing ozone and Ox concentrations is the increasing density of road traffic (Makra et al., 2003; Kiss et al., 2005). Ox is a measure of oxidant concentrations, represented by the sum of O3 and NO2 concentration contained in an air mass (after Warnek, 1999). It is more suitable for the assessment of the photochemical O3 budget than O3 alone, because it takes ozonerelated reversible chemical processes into account as well (Brönnimann & Neu, 1997; Mayer, 1999). The annual course of ozone concentration is connected with the photochemical processes. These, along with road traffic emissions and turbulent mixing, explain the annual course of NO and NOx concentrations (maxima in winter, minima in summer). The shape of the annual course and the values of the trace gases examined (Fig. 4) have not changed during the last few years (see also Fig. 3 and Table 2).
Dynamic and statistical modelling of urban air quality
Air pollution levels depend on (i) total emissions, (ii) transport, (iii) chemical transformation phenomena, and (iv) deposition processes in the atmosphere. The complexity of the overall issue calls for the use of mathematical tools, the so-called air pollution models. There are a wide variety of model types available for use in air quality modelling.
Air quality models can be classified with respect to the scale of the phenomena (see Fig. 5) they are developed to simulate. For urban areas we distinguish local scale models – which include street canyon models – from urban scale models. The model domain of a street canyon model is the size of a street. The obstacles (i.e., buildings) are resolved. The model domain of a local scale model is a town or city district (up to 10 km x 10 km). The phenomena that can be resolved by local scale models have to cover a lifetime of at least several minutes and a horizontal scale of several metres. Integration time for one-day simulation should be performed in a few hours.
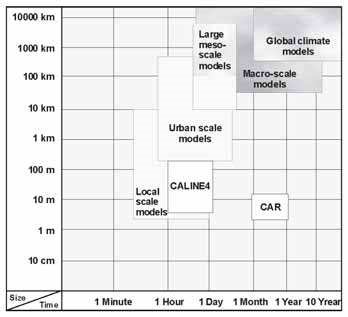
Fig. 5. Spatial and temporal scales of air quality models based on Moussiopoulos et al. (2003). Resolution of CALINE4 and CAR traffic models is also indicated
Urban scale and other larger scale models do not explicitly treat each building, but include the effect of them by using a corresponding roughness length. The model domain of an urban scale model is the size of an EU country or part of one (up to 500 km x 500 km). Urban scale models may be integrated for several days when using a nesting approach. They can resolve phenomena that have a characteristic time scale of more than 10 minutes and a characteristic horizontal scale of more than several hundreds of metres. The synoptic scale model domain covers the European-Atlantic region (5000 km x 5000 km) and the macroscale models have a model domain that covers part of the globe (larger than 5000 x 5000 km2).
Models can be generally divided into four categories, based on the methods used for the calculations: 1) statistical analysis models, 2) Gaussian models and 3) Lagrangian models. Most models, however, use an 4) Eulerian approach to calculate pollution transport. Some models may make use of more than one methodology and may fall into more than one category.
1 Statistical
Statistical models are based on relationships, usually originally founded in physical concepts, between observations and some other relevant parameters. There are a wide variety of statistical methods available including regression, neural networks, etc. that can be used. Since the relationships are based on observations, statistical models need to be established in each environment in which they are used. Statistical models simply require single-valued meteorological data extracted from a coupled meteorological model. They are not usually suitable for carrying out mitigation planning, as they do not causally relate emissions to concentrations.
2 Gaussian
These types of models solve analytical equations that are usually approximations to the physical processes governing the chemistry and/or transport and diffusion. A typical example of this type is the Gaussian plume model, which assumes that turbulent dispersion can be described using a Gaussian distribution profile. These types of models are often used since they have been found under many circumstances to provide good estimates of concentrations from industrial or traffic sources. Other types of models that fall into this category are well-mixed box models or other non-Gaussian types that include higher order moments in their dispersion description. There are also a number of analytical models that may provide statistical assessments. Gaussian models used for screening applications for industries are often of this type. These models require meteorological data for a single point or possibly a vertical profile and the evaluation of the Monin-Obukhov turbulence scaling parameters. Even if the interface module computations required by the previous classes are quite limited, the extraction of three-dimensional meteorological data representative of conditions assumed to be uniform over the whole urban area is quite critical, especially for large cities located in complex terrain.
3 Lagrangian
Lagrangian models can refer to a wide variety of models but they all encapsulate the concept that the model describes, or utilizes, trajectories of single or multiple particles as the reference frame for the model. These models need: 3D fields of average quantities like wind, temperature, humidity and possibly turbulent kinetic energy; 2D surface fields like precipitation, sensible heat flux, friction velocity and Monin-Obukhov length; 3D turbulence fields, like wind variances and Lagrangian time scales, that have to be evaluated from mean variables or reconstructed from boundary layer scaling parameters.
The chemistry models applied range from no chemistry via simple gas-phase chemistry considering NO, NO2 and O3, to complex gas phase reaction schemes. Aerosols are mostly treated as being passive but some steps are taken to consider chemically active aerosol or aqueous phase chemistry. Most models use a resistance model for calculating dry deposition, but only very few models consider wet deposition for different pollutants.
4 Eulerian
Eulerian models are the most widely used models for urban and regional scale applications. Equations of motion, chemistry and other physical processes are solved at regular fixed points in space. The Eulerian grid can be, as for regional scale models, based on geographic coordinates such as latitude and longitude, or on local coordinates for distance. For urban scale applications, grid sizes are generally in the range of 1–5 km and for regional scale applications the range is 10–50 km. High resolution Eulerian models are also available, which can solve the equations of motion down to metre-scale, or even less. These types of models, Large Eddy Simulation (LES) or Computational Fluid Dynamics (CFD) models, can resolve buildings and other obstacles and allow a level of detail at hot-spots that cannot be achieved using the larger meso-scale models. 3D Eulerian models need the 3D average meteorological fields. The Eulerian horizontal and vertical dispersion coefficients (KH, KZ) produced by numerical weather prediction models can be directly used in these models. Nevertheless this practice is not always possible or advisable, and therefore the interfaces for Eulerian models are usually implemented with capabilities to re-compute turbulence parameters from mean meteorological variables and scaling parameters.
Though the European Air Quality Directives do not specify any selection criteria among air pollution transport models other than the quality objectives, it is understood that some models are more suitable than others for the assessment applications. All types of models are presently used for air quality management and forecasting in urban areas at European cities. The latest-generation steady-state models (Helsinki and Bologna) and Eulerian Chemical Transport Models (Budapest, Oslo, Turin, London and Castellon/Valencia) have been implemented into the respective air quality forecasting systems, while Lagrangian models are used for emergency preparedness systems (Copenhagen).
The regulatory line source models can be broadly classified as Gaussian, Eulerian or Lagrangian models. Lagrangian dispersion models (like GRAL) have become increasingly more feasible, due to the advances in computer technology (Oettl et al., 2001a). Computations using Lagrangian dispersion models are still limited by computing capacity usually available for regulatory dispersion studies. The ROADWAY (Eskridge & Catalano, 1987) and MGO (Berlyand et al., 1990) models are based on a K-theory (Eulerian) approach. An obvious advantage of the K-theory models is that they can readily include the interaction of diffusion processes and chemical transformation. Both Eulerian and Lagrangian models are less limited by topographical and meteorological conditions than Gaussian plume models (Oettl et al., 2001b). Different versions of the Gaussian line source model have been used for dispersion evaluations from a road. Such models include HIWAY-2 (Petersen, 1980), CALINE4 (Benson, 1986 and 1992), GM (Chock, 1978), GFLSM (Luhar & Patil, 1989) and OMG (Kono & Ito, 1990).
Urban climate and urban air quality research in Szeged
Geographical location and air quality conditions of Szeged
The city of Szeged, the largest town in southeast Hungary, (20°06′ E; 46°15′ N) is located at the confluence of the rivers Tisza and Maros, characterized by a landscape of extensive flats and an elevation of 79 m a.s.l. (Figs. 6–7). Szeged and its surroundings are not only characterized by extensive lowlands but the city also has the lowest elevation of any city in the Carpathian Basin, putting it in a special, so-called “basin-in-abasin“ or “double basin” situation. This special situation is also favourable to the development of stronger anticyclonic situations, enabling the enrichment of pollutants in the air.
In a detailed analysis, Szeged was ranked 32nd out of 88 Hungarian cities by the quality of its environment and its level of environmental awareness. [The city ranked 1st was considered to have the best environmental conditions (Makra et al., 2002).]
The air quality of Szeged is basically determined by nitrogen oxides (NOx) (Fig. 4), ozone (O3) (Fig. 4) and particulate matter (PM10) (Fig. 8). The concentrations of these parameters tend to exceed the air quality limit values of EU standards (Fig. 4 and Fig. 8). [The daily (24hour) concentration of particulate matter in few cases is 11–19 times higher, while its annual concentration is twice the EU standard (highly protected area).] The high concentrations of particulate matter are closely correlated to the development of respiratory diseases. The annual trends of the air pollutant levels follow a unimodal distribution. The concentrations of NO, NO2 and PM10 are characterized by summer maxima and winter minima. At the same time, ozone reaches its maximum in the summer, in accordance with the annual change of irradiation (Makra & Horváth, 2001; Makra et al., 2001a; 2001b; Mohl et al., 2002; Mayer et al., 2004).
About 50% of the particulate matter comes from the region northwest of Szeged covered by shifting sands, loess and sandy ridges. At the same time, the industrial district is found at
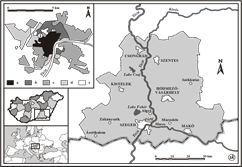
Fig. 6. The geographical position of Szeged, Hungary and types of built-up areas of the city (top left) [a: city centre (2–4-storey buildings); b: housing estates with prefabricated concrete slabs (5–10-storey buildings); c: detached houses (1–2-storey buildings); d: industrial areas; e: green areas; (1): monitoring station]
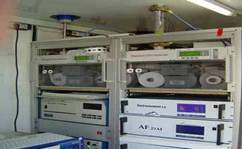
Fig.7.Instruments of the monitoring station. Measurement program: O3, NO, NO2, SO2, CO, PM10 and standard meteorological measurements (temperature, relative humidity, wind speed and direction, global radiation and precipitation)
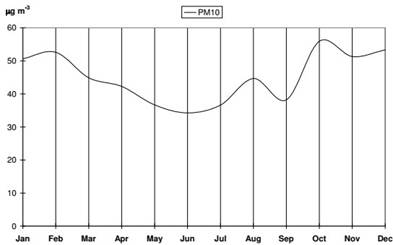
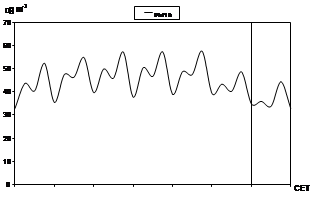
Fig. 8. Average annual variations of PM10, monitoring station, Szeged, 1997-2001 the northwest part of the town. Hence, the dominant north-westerlies transport particulate matter as well as pollutants of industrial origin over Szeged. The rest of PM10 originates in traffic. Particulates are produced partly by vehicle engines and partly by air currents when passing vehicles churn dust into the air (Mohl et al., 2002).
Another serious environmental health problem arises during late summer and early autumn caused by the pollen of ragweed with mugwort leaves or short ragweed (Ambrosia artemisiifolia = Ambrosia elatior), considered the most dangerous of all pollens. The annual pollen counts of ragweed in Szeged are one or two orders of magnitude higher than those in other European cities. Hence, in this respect, Szeged is considered one of the most polluted cities in the continent (Makra et al., 2004; 2005).
The objectives of this section are: (i) to determine the typical diurnal, weekly and annual variations of traffic-related air pollutants NO, NO2, O3, Ox and PM10 in Szeged, (ii) to determine statistical interrelationships of these air pollutants, furthermore, (iii) as a case study, to analyse their connection to meteorological elements for Szeged, by using the dataset of selfperformed traffic census. On the basis of these datasets we analyse the interrelationship of traffic density, pollutant levels and meteorological elements. Further points of the analysis are evaluating the air quality of Szeged using different indices, comparison of pollutant characteristics on weekdays vs. non-weekdays, expressing the efficacy of classifying air pollutants on objective and subjective weather types, expressing the role of the meteorological elements in enriching/diluting pollutant concentrations and modelling the air quality of Szeged by applying CALINE4 and CAR models and comparing their results.
Location of the monitoring station and the database
The monitoring station is located in downtown Szeged in a crossroad with heavy traffic (Kossuth Avenue and Damjanich Street), about 15 m distance from Kossuth Avenue and ca. 30 m away from the road axis. This is one of the busiest crossroads of Szeged. The monitoring station was put into operation on September 1, 1996. Sensors, measuring concentrations of air pollutants, are placed 3 m above the surface. Values of the meteorological elements and concentrations of the main air pollutants (CO, NO, NO2, SO2, O3 and PM10) are measured at the monitoring station (Fig. 7).
The following meteorological and pollution parameters are used in the study. The 12 meteorological parameters used are as follows: mean temperature (Tmean, °C), maximum temperature (Tmax, °C), minimum temperature (Tmin, °C), daily temperature range (ΔT = Tmax – Tmin, °C), wind speed (WS, m s–1), relative humidity (RH, %), irradiance (I, MJ m–2 day–1), saturation vapour pressure (E, mm Hg), water vapour pressure (VP, mm Hg), potential evaporation (PE, mm), dew point temperature (Td, °C) and atmospheric pressure (P, mm Hg). The 8 pollution parameters considered are the average diurnal mass concentrations of the following pollutants: CO (μg m–3); NO (μg m–3), NO2 (μg m–3), SO2 (μg m–3), O3 (μg m–3) and PM10 (μg m–3) as well as the daily ratios of NO2/NO and the daily maximum concentrations of O3 (μg m–3).
Results
Comparison of the annual variation of the pollutant concentrations and its effect on variability
The diurnal concentrations of NO display a clear annual variation, while those of NO2 and PM10 indicate less definite variation with much higher fluctuation. However, annual variations for all three are characterized by winter maxima and summer minima. In contrast, the diurnal concentrations of O3 with a clear annual variation have a winter minimum and a summer maximum.
The average weekly variations of the air pollutants, after the annual variation had been removed, were also determined. The highest concentrations are observed in winter and the lowest ones in summer. On the other hand, the varitation of O3 concentrations has weekday minima and weekend maxima. On weekdays the concentration of traffic-related NO is high. After reacting with O3, its concentration decreases:
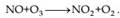
Conversely, at the weekend, the concentration of O3 is high, due to the relatively low traffic. Fig. 4 represents the average annual variations of NO, NO2, O3 and Ox. The annual variation of the primary air pollutant NO displays the greatest values in November, December and January, with a maximum in February (Fig. 4). As the NO concentration depends not only on the rate of emission, but on the prevailing weather conditions as well, higher winter values refer to atmospheric stability with frequent inversions. The average annual variation of NO has the lowest values during the summer (June and July), when air mass exchange is the most intensive. The annual variation of NO2, a secondary substance produced mainly by chemical reactions, follows a similar course to that of NO (Fig. 4). Tropospheric ozone is produced via the effect of short-wave radiation on substances emitted from anthropogenic sources. The role of solar radiation in the troposphere, producing photochemical O3, can be expressed by the following pair of chemical equations:
(h: Planck-constant; ν: frequency of irradiance; M: usually a molecule of O2 or N2) (Sindosi et al, 2003). [Simple chemical reactions influence daily variations of NO, NO2 and O3.] Consequently, the average annual variation of O3, together with that of Ox, has the greatest values in the summer (June and July) (Fig. 4) (Makra et al, 2001a). In Szeged, the average annual variation of PM10 has the greatest values in November, December and January and the lowest ones in the summer months (Fig. 8). Stable anticyclonic weather situations favour accumulation of pollutants. The lowest values during the summer (June, July, August and September) can be explained by dilution caused by intensive vertical exchange in the atmosphere (Fig. 8) (Makra et al., 2001a; Makra, 2005; Makra et al., 2010).
Weekly and diurnal variations of the pollutant concentrations
The diurnal variations of NO and NO2 have the shape of a double wave, with bigger amplitudes for NO than for NO2 (Fig. 9a). Due to the traffic density, the concentration of NO is relatively higher on weekdays than on weekends. This effect can also be observed for the secondary substance NO2. The average diurnal variations on weekdays are greater for NO than for NO2, because NO2 has a longer lifetime than the more reactive NO (Fig. 9a). Generally, the NO concentrations are higher in the morning than in the evening. This can be explained by the fact that in the morning the rush hour is shorter, and the atmosphere near the surface is more stable than in the evening. The low NO concentrations early in the afternoon result mainly from the reduction of O3 by NO. A maximum takes place in the early afternoon caused by photochemical O3 formation, while a minimum occurs after midnight. On the basis of its definition, the diurnal variation of Ox is similar to that of O3 (Fig. 9a). On weekends the average O3 maximum values are higher than on weekdays, but this is not valid for Ox (Makra et al., 2001a; 2010).
The weekly and diurnal variations of PM10 have the shapes of double waves (Fig. 9b). Both primary and secondary maxima can be observed during peak hours and, in the same way, primary and secondary minima occur when traffic is the lowest (at night) or is decreasing (around midday). Also, due to the dense traffic, the concentrations of PM10 is relatively higher on weekdays and lower at weekends (Fig. 9b).
Air quality of Szeged based on different indices
Standards for the assessment of single air pollutants exist in almost every country of the world, e.g. in EU directives. However, these standards are insufficient in view of the persistent demands (e.g. from planners) for the assessment of air quality as a whole, which is not limited to a single air pollutant. Therefore, indices on the basis of routinely monitored air pollutants were developed. The indices represented here are only statistical and have no direct relation to the well-being and health of human beings. They indicate mainly the content of air pollution in the ambient air and are therefore called air stress indices ASI (Mayer et al., 2002b). They can be calculated according to the following formulae:
Planning-related air stress index ASI1 for mean stress, developed by the Office of Environmental Protection, Division of Urban Climate, City of Stuttgart, Germany:
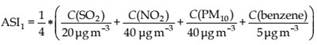
C: arithmetical annual mean values (µg m–3); reference values (denominators of the addable sums): air pollutant specific EU standards (Mayer et al., 2002b).
0 6 12 18 0 6 12 18 0 6 12 18 0 6 12 18 0 6 12 18 0 6 12 18 0 6 12 18 0
Monday Tuesday Wednesday Thursday Friday Saturday Sunday
(a)
0 6 12 18 0 6 12 18 0 6 12 18 0 6 12 18 0 6 12 18 0 6 12 18 0 6 12 18 0
Monday Tuesday Wednesday Thursday Friday Saturday Sunday
(b)
Fig. 9. Average weekly and diurnal variations of NO, NO2, O3, Ox (a) and PM10 (b), monitoring station, Szeged, 1997–2001
Planning-related air stress index ASI2 for short-term stress, developed by the Office of Environmental Protection, Division of Urban Climate, City of Stuttgart, Germany:
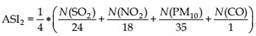
N: number of cases per calendar year when air pollutant specific EU limit values are exceeded [SO2: 350 μg m–3 (1 h mean value), NO2: 200 μg m–3 (1 h mean value), PM10: 50 μg m–3 (daily mean value), CO: 10 mg m–3 (highest daily running 8 h mean value)] (Mayer et al., 2002b).
A graded assessment scale (Table 3) is available for the air stress indices ASI1 and ASI2 (Mayer et al., 2002b), which can for example serve as a basis for planning specific recommendations with respect to air quality.
Table 3. Assessment of air quality conditions on the basis of ASI1 and ASI2 (Mayer et al., 2002b)
Considering only values of either ASI1, or ASI2, the air quality of Szeged can be characterized by strong air stress (level V) in each examined year. For further analysis (Table 3): on the one hand, concentration of PM10 (considered for calculation of ASI1) exceeds its limit value in each of the five years; on the other hand, both for PM10 and CO the number of actual times specific limit values were exceeded (considered for calculation of ASI2) is several times higher than that of the limits in all five years. Consequently, independently of the actual values of either ASI1 or ASI2, the air quality of Szeged can be characterized by extreme air stress (level VI) (Table 3).
Air stress index ASISz on a daily basis, developed by the Federal State Institute for Environmental Protection Baden-Wuerttemberg, Karlsruhe, Germany:

Lower index Sz indicates datasets of Szeged, to which this air stress index is applied. C(SO2), C(NO2), and C(O3): highest daily 1 h mean values (µg m–3), C(CO): highest daily running 8 h mean value (mg m–3), C(PM10): daily mean value (µg m–3); limit values based on EU directives (Mayer et al., 2002b).

Impact-related indices, which are called air quality indices, constitute the second group of indices for the assessment of the air quality effective complex. Such indices are very rare, because it is difficult to quantify the impacts of air pollutants on the well-being and health of human beings. The methodology of air quality indices is to assign concentrations of ambient air pollutants to different air pollutant specific ranges. The air quality index itself is represented by the highest index class among the considered air pollutants. The relation to the impact on human beings is given by different classified ranges of air pollutant concentrations, which are derived from epidemiological and toxicological investigations (Mayer et al., 2004). A new impact-related air quality index obtained on a daily basis and abbreviated as DAQx
(Daily Air Quality Index) was recently developed and tested by the Meteorological Institute, University of Freiburg, and the Research and Advisory Institute for Hazardous Substances, Freiburg, Germany (Mayer et al., 2002a; 2002b). DAQx considers the air pollutants SO2, CO, NO2, O3, and PM10. To enable a linear interpolation between index classes, DAQx is calculated for each air pollutant (x) by

with Cinst: highest daily 1 h concentration of SO2, NO2, and O3, highest daily running 8 h mean concentration of CO, and mean daily concentration of PM10; Cup: upper threshold of specific air pollutant concentration range; Clow: lower threshold of specific air pollutant concentration range; DAQxup: index value according to Cup; DAQxlow: index value according to Clow (Mayer et al., 2004).
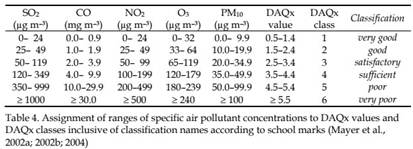
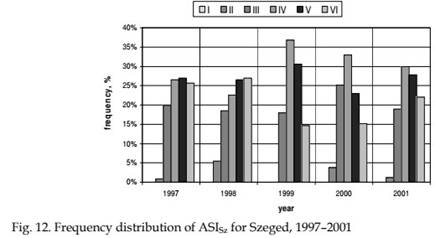
To investigate the sensitivity of indices for the assessment of air quality conditions, frequency distributions for ASISz as an exponent of air stress indices and DAQx as an exponent of air quality indices were calculated for Szeged downtown. ASISz as well as DAQx are indices on a daily basis. Since ASISz has no relation to the impact on human beings, six classes were statistically defined on the results of five-year (1997–2001) daily values (Table 4) (Makra et al., 2003).
The daily values of both ASISz air stress index and DAQx air quality index were calculated for the examined five-year period. Results are shown only for 2001 (Figs. 10–11). Empty sections on the figures indicate lack of data. ASISz values – exceeding level III – presenting increased air stress as well as peak values are concentrated in the winter half-year or in the winter months (Fig. 10). This can be explained by climatic reasons. The standard deviation of DAQx values is less than that of ASISz values. Peak values of DAQx are also concentrated in the winter half-year (Fig. 11); however, this is not as characteristic as in the case of ASISz values. The reason of this is that the vertical axis of the diagram for ASISz is linear, while that of the diagram for DAQx is not (Makra et al., 2003).
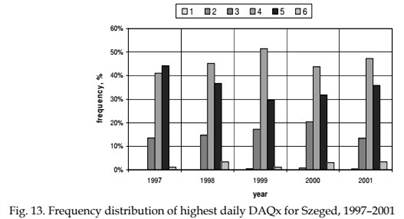
Frequency distribution of ASISz and DAQx according to both classes and years are different. DAQx values indicate generally higher frequencies in levels IV and V; on the other hand, they are sparse in the remaining levels compared to the frequency distribution of ASISz values in levels I-VI (Fig. 12) (Makra et al., 2003; Mayer et al., 2004).
CO and PM10 are mainly responsible for the frequency changes of DAQx classes (Fig. 13) (Makra et al., 2003; Mayer et al., 2004).
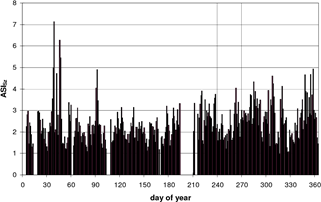
Fig. 10. Air stress index ASI for Szeged (ASISz) on a daily basis, for the days of year 2001
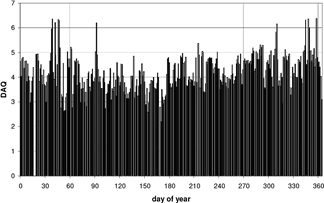
Fig. 11. Air quality index highest DAQx for Szeged on a daily basis, for the days of year 2001
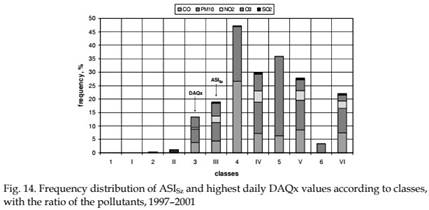
Share of the different pollutants in ASISz and DAQx values (Fig. 14) can be clearly deduced by the formula of ASISz and the DAQx classes (Table 4), respectively. Analysis of both ASISz and DAQx values represents high pollution load of PM10 and carbon-monoxide. PM10 and CO several times exceeded their standards, substantially modifying the air quality of Szeged (Fig. 14).
Statistical relationship between air pollution and meteorological parameters
This section deals with the levels of air pollutants in Szeged in relation to Péczely’s weather types based on sea level pressure, subjectively defined over the Carpathian Basin (Péczely, 1957). Specific large-scale weather situations both for winter and summer months were found to play a significant role in the pollutant concentrations in Szeged. Since no ozone parameters show significant Péczely’s inter–weather type differences in mean concentrations neither in the summer nor winter months, the secondary pollutants were omitted from further consideration.
On the basis of the mean values of the air pollutants for the days belonging to the 13 Péczely types and Péczely’s weather type – air pollution difference matrices, the following characteristics of their inter-relationships are observed. The short interpretation of the 13 Péczely’s large-scale weather situations are indicated below Table 5.3 In the winter, types 9, 12 and 11 are the most efficient in enriching the air pollutants, while (in decreasing order) types 11, 6 and 1 in diluting them. The dubious role of type 11 can probably be attributed to the fact that on the days belonging to this type substantially different wind speeds can occur. In the summer, the role of type 5 is exclusive (78.1%) in enriching the pollutants, at the same time types 2, 8, 1 and 11 are the most important in diluting them (Table 5).
During the study period, the number of industries around and inside the city, as well as the number of cars, did not change substantially and therefore the emissions can be considered stable. Thus, the findings of this section record the influence of the atmospheric circulation in the air quality of Szeged relatively well. This would not be the case if some large industrial units had started or ceased operation in the neighbouring countries and thus the long-range transport of pollutants had modified the pre-existing atmospheric situation in Szeged; however, such great changes, according to our knowledge, did not occur during the study period.
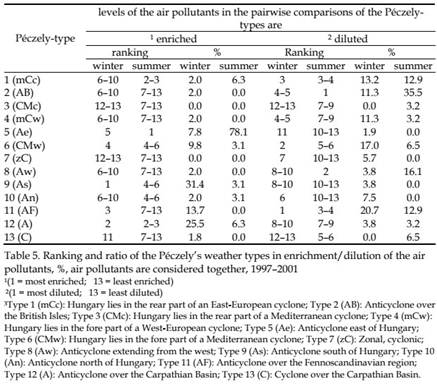
3Type 1 (mCc): Hungary lies in the rear part of an East-European cyclone; Type 2 (AB): Anticyclone over the British Isles; Type 3 (CMc): Hungary lies in the rear part of a Mediterranean cyclone; Type 4 (mCw): Hungary lies in the fore part of a West-European cyclone; Type 5 (Ae): Anticyclone east of Hungary;
Type 6 (CMw): Hungary lies in the fore part of a Mediterranean cyclone; Type 7 (zC): Zonal, cyclonic;
Type 8 (Aw): Anticyclone extending from the west; Type 9 (As): Anticyclone south of Hungary; Type 10 (An): Anticyclone north of Hungary; Type 11 (AF): Anticyclone over the Fennoscandinavian region;
Type 12 (A): Anticyclone over the Carpathian Basin; Type 13 (C): Cyclone over the Carpathian Basin.
On the basis of previous works, connection of both the objectively determined air-mass types (Makra et al., 2006a; 2006b) and the subjectively defined Péczely’s weather types (Makra et al., 2007a; 2007b) on the one hand, and pollen grain and chemical pollutants concentrations in Szeged, on the other, detected that pollen and chemical pollutant levels can be associated to different pressure patterns ruling the region examined.
When considering pollen release of the species considered in the pollination period, some objective and subjective weather types are favourable, while others are negligible in the classification of pollen levels. On the other hand, when analysing levels of the chemical pollutants: (1) objective types with anticyclonic character are mostly favourable both in winter and summer, while those with cyclonic character are mostly negligible in winter (Makra et al., 2006a); (2) Péczely’s anticyclonic types in winter are mostly favourable, while cyclonic ones are mostly negligible in classification of pollutant levels; at the same time, in the summer none of them is predominant (Makra et al., 2007a). Hence, while the objective weather types have a significant role, Péczely’s large-scale weather situations cannot be considered as an overall system in the categorization of pollutants concentrations.
Accordingly, for the classification of pollen release of the species, neither the cyclonic nor the anticyclonic weather types show a clear character within the objective and the subjective weather classification systems. On the other hand, for classifying the chemical pollutants, the objective types with anticyclonic character are effective in both extreme seasons (Makra et al., 2006a), while Péczely’s cyclonic and anticyclonic types have an emphasized role only in winter, whereas they are inefficient in summer (Makra et al., 2007a).
When disregarding anticyclonic and cyclonic character of the weather types and taking into account pairwise comparisons for each type, efficiency of the pollen related objective air mass types seems to be much higher than that of Péczely’s weather types. Furthermore, the efficiency of the chemical pollutants related objective types seems to be significant in both seasons, while a substantial decrease of that can be observed for Péczely’s classification in the summer months. Hence, Péczely types seem practically useless in classifying air pollutants in summer. As a result of the above, the objective air mass types are more efficient than Péczely’s weather types in classifying either biological or chemical air pollutants and in addition can be used more efficiently in the air pollution forecast (Makra et al., 2009).
The effect of traffic on air quality by applying CAR and CALINE4 dispersion models
EU urban areas host 80% of the population and generate 75 to 85% of the gross national product. They play an essential role in the vitality and competitiveness of Europe. However, this vitality is today endangered by the impact of non-sustainable urban modes of transport. The use of private cars generates pollution, high energy consumption, noise, congestion and accidents. Reducing emissions, improving air quality, reducing accidents and congestion, reducing social deprivation, and thus increasing the quality of life in urban areas, requires a modal shift from private transport to public and sustainable transport. The aim of this section is to analyse how air pollution of vehicular traffic changed on the main roads of the Szeged region (Fig. 6, 21) in the period 1995–2008.
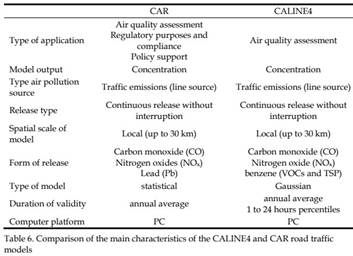
Air pollutant concentrations were simulated using CALINE4 and CAR road traffic dispersion models. The spatial and temporal resolutions of both models are indicated in Fig 5. The main characteristics of the CAR model in comparison with those of the CALINE4 model are summarized in Table 6. For a more detailed description see Gyöngyösi, et al (2009).
Description of the CALINE4 model
CALINE4 is a fourth generation line source air quality dispersion model developed by the California Department of Transportation. It is based on “Gaussian” and “Fickian” diffusion equations and employs a mixing zone concept to characterize pollutant dispersion over the roadway. A fairly extensive evaluation of the line source dispersion model CALINE4 was performed by Benson (1992).
The purpose of the model is to assess air quality impacts near transportation facilities, in other words to predict air pollution concentrations near roadways. Given source strength, meteorology and site geometry, CALINE4 can reliably predict pollutant concentrations for a receptor located within 150 metres of roadways and can be used with reliability until within 500 m of roadways. In addition to predicting concentrations of relatively inert pollutants such as carbon monoxide (CO), the model can predict nitrogen dioxide (NO2) and suspended particle concentrations. It also has special options for modelling air quality near intersections, street canyons and parking facilities.
The equation below shows the Gaussian diffusion equation for line sources, including reflection, for a differential highway length with uniform source strength.
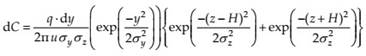
where:

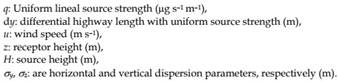
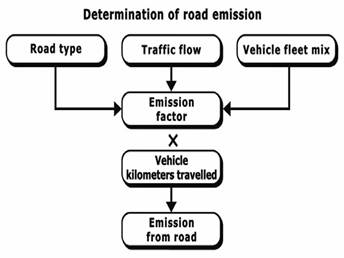
Fig. 15. Calculation of emissions in the CALINE4 model (Benson, 1992)
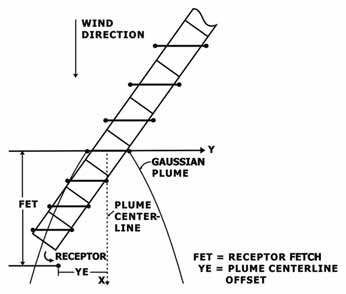
Fig. 16. Application of a Gaussian plume for road segments (Benson, 1992)
CALINE4 divides individual highway links into a series of elements from which incremental concentrations are computed and then summed to form a total concentration estimate for a particular receptor location (Figs. 15–16). Each segment of a roadway link is treated as a separate emission source producing a plume of pollutants which disperses downwind. Pollutant concentrations at any specific location are calculated using the total contribution from overlapping pollution plumes originating from the sequence of roadway segments (Figs. 15–16).
Downwind concentrations from the element are modelled using the crosswind FLS (Finite Line Source) Gaussian formulation, but σy and σz are modified to consider the mechanical turbulence created by moving vehicles and the thermal turbulence generated by hot vehicle exhaust over the highway (Fig. 17).
CALINE4 treats the region directly over the highway as a zone of uniform emissions and turbulence. This is designated as the mixing zone (Fig. 17), and is defined as the region over the travelled way (traffic lanes not including shoulders) plus three metres on either side. The additional width accounts for the initial horizontal dispersion imparted to pollutants by the vehicle wake. Within the mixing zone, the mechanical turbulence created by moving vehicles and the thermal turbulence created by hot vehicle exhaust are assumed to be the dominant depressive mechanisms (Fig. 17). In CALINE4, a computational scheme called the Discrete Parcel Method (Benson, 1984) is used to model NO2 concentrations. The Discrete
Parcel Method fixes the initial mixing zone concentrations of the reactants on the basis of
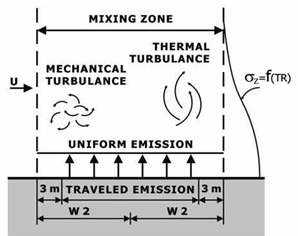
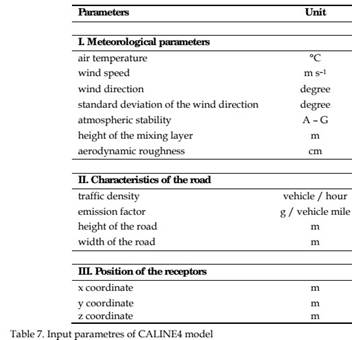
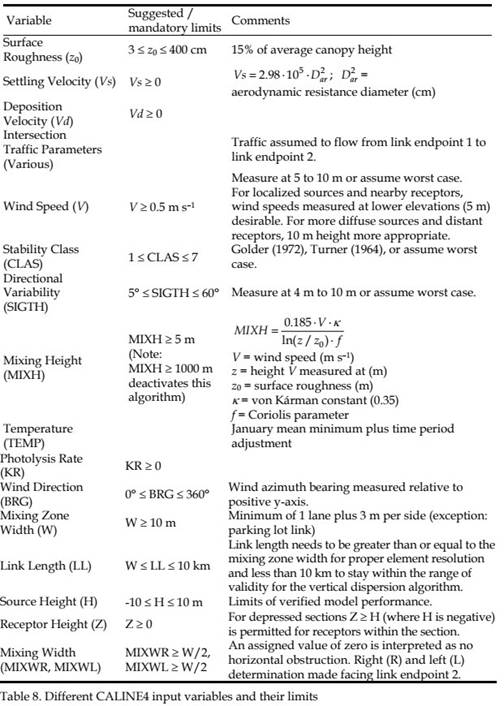
Fig. 17. Mixing zone concept in CALINE4 (Benson, 1992) ambient and vehicular contributions. Input values required by CALINE4 to compute the pollutant dispersion include: link geometry (highway), link activity (traffic, emission), run conditions and receptor locations. Table 7 shows a complete list of all input parameters. Furthermore, Table 8 is intended to help the user assign proper and realistic values to the input variables used by the model. The limits of different CALINE4 input variables are also involved.
Input requirements
The Gaussian formulation used is based on two somewhat restrictive assumptions: 1) horizontally homogeneous wind flow; 2) steady-state meteorological conditions. For these reasons CALINE4 needs a simple orography.
There are some drawbacks, however, to this model: Since it is a Gaussian dispersion model and uses modified Gaussian dispersion parameters (σy and σz) which are fairly accurate only up to a distance of 10 km, it is important that no road links should exceed 10 km in length. The model also specifies that in a single run, the total number of links should not be more than 20. A required parameter from the run options is wind speed. The model can handle only wind speeds exceeding 0.5 m s–1. For each receptor (maximum number of receptors is 20), inputs are required for coordinates x, y and height (z). The user must also define CO emission factors for each roadway link.
Results from the CALINE4 model
Annual mean concentrations, as means of all receptors for both CO (Fig. 18a) and NO2 (Fig. 18b) on the major roads of the Szeged region modelled at a height of one metre, show clearly increasing trends. Annual mean CO and NO2 concentrations on some major roads of the Szeged region, considered on a function of the receptors, indicate higher values in the downtown and lower ones towards the outskirts. Furthermore, they show partly slight (CO) and partly definite (NO2) increasing trends (Figs. 18a–18b). Annual mean CO (Figs. 19a–19b) and NO2 (Figs. 20a–20b) concentrations on the major roads of Szeged region are calculated using the CALINE4 model for each year in the period 1995–2007. However, CO and NO2
CO
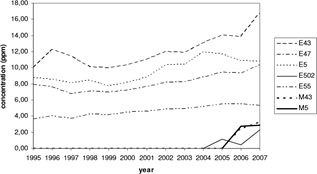
Fig. 18a. Annual mean CO concentrations in ppm (h = 1 m) , as means of all the receptors, on the major roads of the Szeged region (see the map in Fig. 21), 1 ppm CO ~ 1,15 mg m–3 CO
NO2
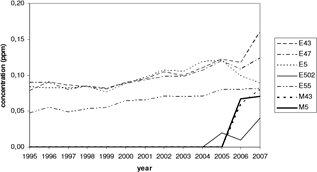
Fig. 18b. Annual mean NO2 concentrations, as means of all the receptors, on the major roads of the Szeged region, ppm (h = 1 m), 1 ppm NO2 ~ 1,9 mg m–3 NO2 loads for the starting year (1995) and years 2006 and 2007 are only analysed. The annual mean concentrations clearly indicate the increase of CO levels and a much more definite increase of NO2 concentrations from the beginning till the end of the period examined. The difference of the concentrations is especially striking for years 2006 and 2007 (Figs. 19a–19b; Figs. 20a–20b). This is related to the highly increased transit transport through Szeged from Romania and Bulgaria after these countries entered the European Union on January 1, 2007. The vehicular traffic of the Szeged region is permanently increasing. However, in year 2007 an especially striking increase of vehicular traffic was experienced. Due to the EU membership of Romania and Bulgaria the number of trucks and lorries going through the Szeged region from these new EU countries quadrupled from 2006 to 2007. This increased traffic means a remarkable load on road no. E43. As a result, substantially higher vehicleoriginated air pollution can be experienced as clearly indicated by the CALINE4 dispersion model (Figs. 19a–19b; Figs. 20a–20b) (Makra et al., 2008).
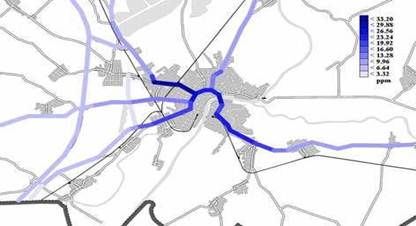
Fig. 19a. Annual mean CO concentrations on the major roads of the Szeged region, 2006, ppm (h = 1 m)
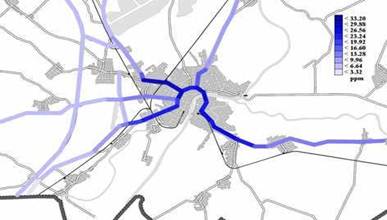
Fig. 19b. Annual mean CO concentrations on the major roads of the Szeged region, 2007, ppm (h = 1 m)
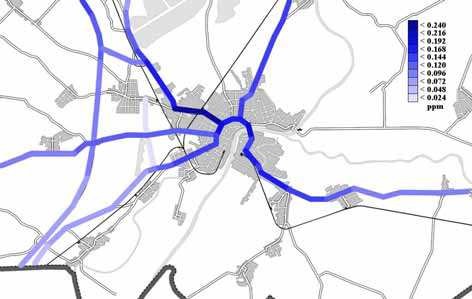
Fig. 20a. Annual mean NO2 concentrations on the major roads of the Szeged region, 2006, ppm (h = 1 m)
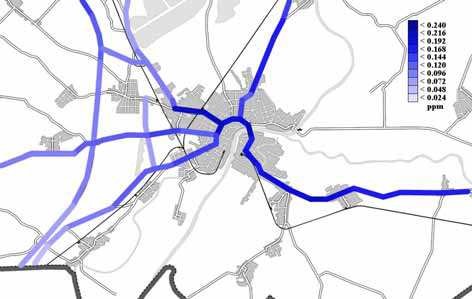
Fig. 20b. Annual mean NO2 concentrations on the major roads of the Szeged region, 2007, ppm (h = 1 m)
More complex approaches to dispersion modelling are unnecessary for most applications because of the uncertainties in estimating emission factors and traffic volumes for future years. CALINE4’s accuracy is well balanced with the accuracy of state of the art predictive models for emissions and traffic. The model also possesses greater flexibility than earlier versions, at little cost to the user in terms of input complexity.
Using CALINE4 dispersion model hourly and 8-hour average concentrations can also be obtained. The hourly NO2 and CO concentrations have been calculated for some main roads of Szeged near kerbsides. During worst-case meteorology NO2 and CO concentrations are shown in Fig. 21. Worst-case meteorology input is the combination of the worst wind speed, wind direction, stability class. CALINE4 has special option for modelling air quality in street canyons. During this model simulation a simple form of canyon effect was also considered. Due to these facts the obtained maximum concentrations are quite high, especially in case of CO when the maximum of worst case 1-hour concentration is 10 times higher than the shorttime limit values for highly protected area (∼ 5 ppm).
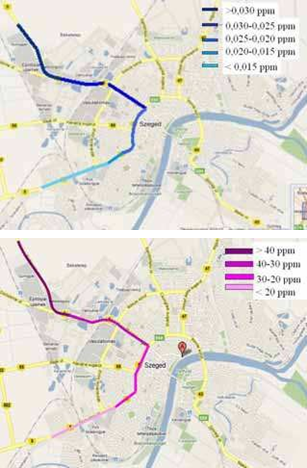
Fig. 21. Worst-case 1-hour NO2 average NO2 (top) and CO (bottom) concentrations at kerbsides calculated by CALINE4, 2008
In order to make a comparative calculation for year 2008, a striking change in NO2 and CO concentrations is experienced along the main road no. E75, going through Szeged. Incoming traffic from Budapest direction involves smaller NO2 and CO levels, respectively, compared to earlier years (Fig. 21, upper part of the coloured curves). On the other hand, outgoing traffic towards Belgrade decreased dramatically, which appeared as a substantial drop in the NO2 and CO concentrations (Fig. 21, lower part of the coloured curves).
During the evaluation of different model results it was established that the calculated annual, daily and hourly mean concentration of different air pollutants can highly depend on several factors for example the distance from the road axis, the height of receptor point, the applied modelling method for averaging and parametrization procedures, applied meteorology and also the emission factors.
Description of the CAR model
The Dutch CAR model (Calculation of Air pollution from Road traffic) (Eerens et al., 1993) uses an empirical approach for the estimation of mean annual concentrations of NO2 and non-reactive pollutants (carbon-monoxide and benzene) in urban and rural areas. The relationship between street geometry types, wind speed and concentrations of the pollutants considered were based on wind tunnel experiments.
The effect of trees along streets and the type or speed of road traffic (from highway traffic at an average speed of 100 km h–1 to a non-continuous, stagnating traffic at an average speed of 11 km h–1) were also considered. A source receptor function is specified for each street category as a function of distance from road axis (from 5 m to 30 m). The effect of cars and trucks are considered separately, and the resulting concentration values are calculated as a sum of the components. The model calculates emission, and regional and city background concentrations are input parameters for them. Annual averages and 1-, 8- and 24-hour 98 percentiles are the outputs of the model for each pollutant (Fig. 22).
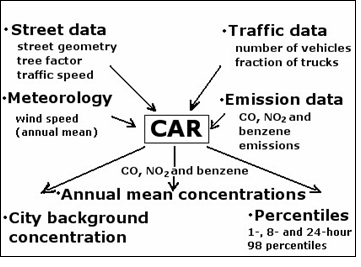
Fig. 22. Schematic diagram of system parameters, input and output data for the CAR model (Eerens et al., 1993)
Air quality calculations with the CAR model – input data
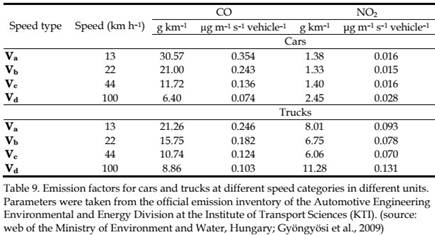
Input data from Szeged were used in our calculations with the CAR model. Street data, such as geometry, traffic type and vegetation have been estimated at a field trip experiment on the site. The default emission factors were changed according to the inventory of the Automotive Engineering Environmental and Energy Division at the Institute of Transport Sciences (web of the Ministry of Environment and Water, Hungary, 2009). For the exact values one may refer to Table 9 below.
Note that the units used in the CAR model (μg m–1 s–1 vehicle–1) differ from those used in other sources (g km–1). For background concentration reference, the measurements from K-puszta have been considered. For city background concentration, annual averages measured by the air quality monitoring station at Szeged were used. Concentration data collected at the air quality monitoring station were compared to the above model output. Traffic census has been performed at 9 different sites in the city (Fig. 23; sites 1 to 9 are from top left to centre right and bottom left). Both the average daily number of motor vehicles passing through each location and the air pollution data were considered for the 12-year period 1997–2008. The temporal course of the mean daily number of vehicles at two different sites (Site 4 and 9) is also presented (Fig. 23, bottom right).
Air quality calculations with the CAR model – results
Results of our numerical calculations are presented in Table 10 and Fig. 24. The main findings are as follows: The measured CO concentrations showed a slight decrease, while the model yielded a 6.88 μg m–3 year–1 increase especially for 2008 due to higher road traffic. On the other hand, no significant change has been observed for NO2 while the model yielded a gradual increase of about ~0.62 μg m–3 year–1. The measured data was slightly smaller than the modelled data. The model results indicate a smaller deviation from the average than the measured data (Fig. 24). The discrepancy may come partly from the fact that the emission parameters were considered constant, although the structure and technical quality of the transportation system in Szeged has been improving considerably. The concentration at the measurement site is the cumulative result of the side street traffic as well, which has changed significantly and was not treated in our calculation.
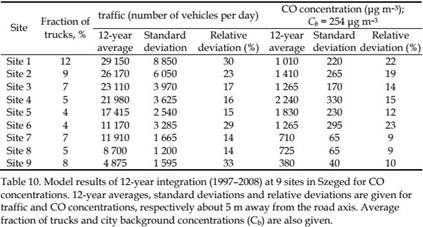
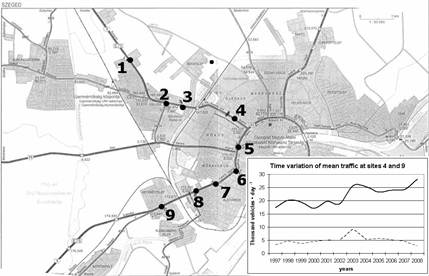
Fig. 23. Map of Szeged with the location of the measurement sites. Bottom right panel: time variation of the daily number of vehicles at two locations (site 4, solid line and site 9, dotted line) for each year (1997–2008)
Fig. 24. Measured and calculated concentration of CO and NO2 for Szeged (1997–2008) close to site 4 about 30 m away from the road axis and 3 m above the surface
An increasing trend is present for the urban average traffic for the annual means taking into account all sites (> 900 vehicles per day per year growth rate for the average during the 12year period). Model results on two different types of urban sites are analysed: An air quality monitoring station is located at site 4, which is a typical dense urban area not so far from the city centre (with an average of 21,980 vehicles per day for the 12-year period 1997–2008), while site 9 is an open suburban site with an average of 4,875, vehicles per day.
Conclusion
In Szeged, the average annual variations of NO, NO2 and PM10 (with maxima in winter) are opposite to those of O3 and Ox (with maxima in summer). The higher winter values are caused by atmospheric stability with frequent inversions. The lowest values in summer are due to dilution generated by intensive vertical exchange in the atmosphere. The highest intensities of photochemical O3 formation are observed during the early afternoon in the day and the summer in the year. After removing the annual variations, the very similar average weekly variations of NO, NO2 and PM10 for Szeged show weekday maxima and weekend minima. Oppositely, those of O3 show weekday minima and weekend maxima. The diurnal variations of O3 show a clear daily course with one wave. On weekends the average O3 maximum values are higher than on weekdays, but this is not valid for Ox. Levels of NO and O3 are traffic-related. Concentrations of both CO and NO are in reverse correlation with wind speed. As both pollutants are predominantly of traffic origin, their concentrations should be correlated, which is indeed the case.
Daily average concentrations of the pollutants increased on weekdays and decreased during weekends. The concentration of O3 presented an opposite trend. At the weekends, air quality improves better in the winter half-year.
Aside from single air pollutant standards, air stress indices and air quality indices enable an additional assessment of the air quality conditions, which is primarily not limited to single air pollutants. The application of air stress indices or air quality indices depends on the specific objectives of the investigation. High values of mean air stress (indicated by ASI1 ≈ 1) as well as extremely high values of short-term air stress (indicated by ASI2 > 20) suppose a high air pollution load in Szeged. Short-term (diurnal) air pollution increased on weekdays and decreased on weekends.
Summarizing the results of the inter-relationships of Péczely’s weather types and daily mean levels of the air pollutants, enrichment of the air pollutants (either in the winter or in the summer; and either considering the pollutants together or separately) occurs exclusively during Péczely’s anticyclone centre or anticyclone ridge weather situations; on the other hand, their dilution can be experienced not only during cyclonic but anticyclonic ridge weather types as well. Efficiency of the objective weather classification, performed for the same period, is almost one order of magnitude higher than that of Péczely’s weather types in classifying the air pollutant levels. CO, SO2 and PM10 are sensitive to the Péczely’s weatherclassification, while NO2/NO, O3 and O3max are completely insensitive. In the winter, Péczely’s anticyclonic types are mostly favourable, while Péczely’s cyclonic types are mostly negligible in classification of pollutant levels. On the other hand, in the summer, none of them are predominant. Hence, although they have a clear role in the winter, Péczely’s large-scale weather situations can not be considered as an overall system in categorization of pollutant concentrations, as they are inefficient in the summer.
Annual mean CO and NO2 concentrations on the major roads of the Szeged region are calculated using the CALINE4 model for each year between 1995–2007. A clear increase in CO levels and a much more definite increase of NO2 concentrations can be observed for the period examined. The difference of the concentrations is especially striking between years 2006 and 2007. This corresponds to the highly increased traffic through Szeged from Romania and Bulgaria after these countries entered the European Union on January 1, 2007. A comparative analysis for year 2008 resulted in a striking change in NO2 and CO concentrations along the main road E75 across Szeged. Incoming traffic from Budapest involves smaller NO2 and CO levels compared to earlier years, while outgoing traffic towards Belgrade radically reduced with substantial drop in both NO2 and CO levels. When studying the sensitivity of the CAR model for Szeged, the concentration of pollutants as a function of distance from road axis, the effects of wind speed, road type and tree factor on the concentration of the pollutants overall and at different traffic speeds were analysed and quantified. According to the results, much higher concentrations occur in the summer than in the winter. This is due to the fact that wind speed is the lowest from late summer until early autumn and vegetation generates a higher effect on wind speed in the summer and autumn than in the winter. Furthermore, it was detected that a doubling in the traffic (i.e. double the number of vehicles) results in a 71% increase in CO concentration. Neither the effect of trees nor the increasing traffic speed can compensate for the effect of a double truck fraction. The fraction of trucks has a great impact on NO2 concentration. Summing up the results, the main findings are as follows: the level of pollution increases with (i) increasing number of vehicles, (ii) decreasing speed in urban traffic (i.e., less than 50 km h–1), (iii) larger fraction of heavy vehicles, (iv) increasing number of trees alongside the roads and (v) smaller mean annual wind speed. In addition, the model was run on realistic input parameters, regional and city background concentrations. Model results have been compared to measurements, showing good agreement with a slight overestimation of concentration, which is due to the insufficient consideration of the technical development of the vehicles. However, modelled data show smaller deviations than measurements.