There is the relationship between physical activity of people and the city environment in which they live. This relationship is researched by project IPEN (International Physical Activity and the Environment Network). IPEN is an international interdisciplinary project. It studies physical activity of citizens in the various structures of the town. There are many determinants that shape the citizen physical activity. The important factors are, for example, distances from home to shops and schools, density of streets, land use in town etc.
Project IPEN has developed a methodology for analyzing city environment according to the physical activity of people. The main result of this methodology is a Walkability index. This index consists of four partial indexes: Connectivity index, Entropy index, FAR index (floor area ratio) and Household density index. Final Walkability index is the sum of partial indexes (where the weight of the Connectivity index is two times bigger than the weight of the other indexes).
The Walkability index can be useful is in the stage of urban planning. High value of Walkability index means that a particular arrangement of the city supports physical activity of people. The low value of Walkability index means that people very often used cars in the everyday life which results into minimum physical activity. The enumeration of the Walkability index is possible for both existing structure of the town and for any proposed urban plan. It is, therefore, a good opportunity for urban planners to evaluate the proposed urban plan from the point of influence on the peoples´ physical activities. Urban planner can so increase the everyday physical activities of citizen by good arrangement of streets and high diversity of land use.
Nowadays, the urban plans are mostly in a digital form. Geographical information systems (GIS) are very often used when creating and maintaining the urban plans. New program tool for automatic calculation of Walkability index has been designed in the Czech Republic at Palacký University. The tool was made as a custom toolbox with tools for ArcGIS software version 9.3 (produced by company Esri). The custom toolbox consists of five scripts in Python language. It is an easy task to calculate Walkability index on the digital urban plan. The tools were tested on the case of Olomouc town structure.
The Walkability index is calculated according to IPEN methodology. The town is divided into several sub areas – small urban units of town. The final Walkability index is calculated for each sub area of town. First partial index is the Connectivity index. It is the number of the streets crossings per sub area. Second is the Entropy index, which represents the diversity in the land use (portion of commercial, residential area, …). Third index calculates FAR index (floor area ratio). This means the ratio of the actual area of commercial objects per area of whole commercial zone in land use category (e.g. the actual area of a shop is only a part of the commercial zone which also includes a car park and other resources). The Household density index represents the number of households per area category used for living and is obtained from the land use layer. Program also adds three new attributes to the table of the urban areas in GIS layers of urban plan.
Urban planners can automatically recalculate the Walkability index of any new version of their urban plan by the program. Finally, it is possible to see the influence of the various versions of urban plan on value of the Walkability index. This index can than be a significant criterion when choosing the most convenient urban plan.
Urban area and the mobility of people
Phases of urban development are related to the economic development of transportation. They are: (a) Initial capitalism phase; (b) Industrial development; and (c) Big traffic problem on the cities (Ávila, 2010). The support of walking and cycling in cities is a partial solution of the traffic problem.
The planners implemented formalist ideas, treating the “city as a machine” after World War II. The towns have increased number of inhabitants and their total areas. Mass industrialization during the 20th and 21st century led to car-centric development, where walking from one place to another is not feasible anymore (Saligaros, 2011). This situation started in the USA and Western Europe. Subsequently, rising of area of cities has appeared in Eastern Europe during last three decades.
The Congress for the New Urbanism (CNU, 1993) officially started the New Urbanism in the USA in 1993. The New Urbanist movement began as a human-scaled alternative to Modernist city planning: while the latter is based upon distances, spaces, and speeds that suit machines and the needs of industry, the former considers instead the very different needs of human beings. Among other things, New Urbanism promotes walkable communities (where people can live, work, and socialize without being totally dependent on cars), and nonrigid zoning that allows a mixture of work, industry, and housing, all done with well-proportioned buildings that borrow heavily from traditional forms and techniques (Saligaros, 2011).
Walking has three dimensions. The first is practical dimension. It is easy to get somewhere by a walk when the distance is short. The second impact is the social dimension. Meeting with other people increases social cohesion. Old cities (Latin tradition) had the central square. In fact, the evening walk around square has a social dimension. The third impact of walking is health impact. This last dimension is in the centre of research of IPEN project.
Jane Jacobs (1992) mentioned in her book that the streets and sidewalks are the most crucial part of city’s safety, because that is how people travel. Not just policemen and cameras solve the criminality. There must be people looking after other people, in a mutually functioning city life in which people can coexist. This idea can belong to the social impact of walking and existence of sidewalks.
Having access to a pedestrian environment offers the possibility of a walk on foot that can be of any duration. A system of complex connected sidewalk geometry allows periodic activity around 15 min (e.g. a trip to a restaurant, shop or park) which are unfeasible in a car city. Some urban planners suggest next obligation. Government must build concrete sidewalks on both sides of all the new streets. Such thought could be especially useful for some of the cities in the USA where new roads are being built without sidewalk.
New phenomena “suburban sprawl” brought great numbers of isolated houses and isolated shopping malls at the edge of cities. This situation implicates necessity of a car when moving for a long commute to work, food shopping, getting children to school, accomplishing regular out-of-house chores, etc. Good idea of “shopping streets” in the central part of urban unit disappeared. People living in suburban cities have less physical activity than people living in the centre of town. Everyday commute to work, school and shopping require car when dwellers live at suburban area. On the other hand, more shops, restaurants and public areas are in the centre of the city. People living in the centre walk more in every day live than people living in the suburban parts.
Comparison of work travel and non-work travel from the point of time is presented by Zhang (2005). Activity-Travel Survey in Boston (1991) compares non-work travel and accessibility to entertaining, recreational, eat-out, and other social opportunities.
The mobility is nowadays a very diverse and complex issue, due to the tendency for a more disperse residential occupation and for more decentralized location of most commercial and service activities, as well as of different population mobility habits resulting from their daily situation. As a consequence, urban mobility has been ever more dependent on the private car and, in many cases, by the existence of inefficient and costly public transport systems, with obvious negative impacts at the environmental, social and economic levels for the society (Seco, Silva, 2010).
Sum of negative influences on dwellers calls for a change in urban planning. Better arrangement of houses, schools, food shops, parks in urban units is essential in order to improve the environment. “Innovation” requires a city environment that encourages a state of emotional and physical well being (Ward and Holtham, 2000).
Physical inactivity is one of the most important public health issues in the U.S. and internationally (Bronson et al., 2009). The physical activity is currently one of the most important factors in the area of public health. In general, it is a policy of various states to increase their citizens’ motoric activity. It is, therefore, a subject of study of many researches all around the world to obtain information about the city structures and evaluate the impact on their inhabitants’ physical activity. The primary assumption of these studies is that the environment greatly determines the amount of physical activity of its inhabitants (AbuOmar & Rütten, 2008; Badland et al., 2008; Giles-Corti & Donovan, 2002). Moreover, it was found out that new city quarters designed with attention to the active transport of people really increases their physical activity (Saelens, Sallis, Black, & Chen, 2003). An urban area with positive influence on its residents’ physical activity typically shows higher number of population, sufficient connectivity, higher value of Entropy index and FAR (Floor area ratio) index (Mitáš, et al. 2008).
Measurement of the physical walking activity
There are various approaches to measuring the physical walking activity of people. It is, for example, possible to perform a questionnaire survey (Bronson, 2009). Another option is to obtain the data from contact chips that are worn by a group of respondents for given time. It is also possible to monitor the number of people passing through a certain place using optical sensors. In addition, there is an option to find the amount of peoples’ physical activity indirectly, by evaluating the arrangement of the city structures (the net of sidewalks and streets) knowing the type of the land use (residential, commercial, recreational). The last indirect method of measuring the physical activity of inhabitants using the GIS in urban units is the subject of this chapter and is described in detail in part 4.
Project IPEN used a small accelerometer ActiGraph (Fig. 1). Respondents wear this sensor with them for one week. ActiGraph measures a frequency of steps, a step distance, number of steps and the intensity of movement. The ActiGraph worn near hip or at waistline gives the best results of measurement. Data are then exported from the sensor for processing and calculation of physical activity. The average number of steps per day is used for evaluation of overall physical activity. Respondents also fill a form about their daily activity for the purpose of checking the ActiGraph measurement. The ActiGraph device was also used during the case study in Olomouc city. Subsequently, the results of the ActiGraph were compared with the output of the GIS (geographic information systems) evaluation.
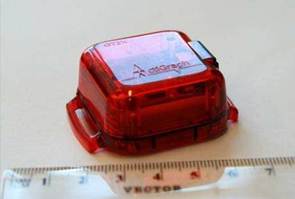
Fig. 1. Accelerometer ActiGraph (Photo: T. Krivka)
Furthermore, literature describes interesting studies of physical activity measurement. Pikora (2002) described a special scan instrument – SPACES (Systematic Pedestrian and Cycling Environment Scan instrument). Scan collects data from a total of 1987 km of roads in metropolitan Perth, Western Australia. Additional city information was collected using desktop methods and GIS. The result from Perth was that neighborhood environmental factors correlated with walking near home.
Another method of acquiring the data about inhabitants’ activity shows Hoedl (2010). The Bikeability and Walkability Evaluation Table (BiWET) was developed in 2007 at the University in Graz, Austria. The BiWET is designed for fast assessment of 15 predetermined characteristics of 10-m street segments. Inter-rater and Intra-rater reliability was calculated in 2008 based on the auditing data of 152 km of commuting routes of city dwellers in 2007. Research project in Graz developed and tested a simple and efficient audit tool to get a quick overview of built environment along a route or in a neighborhood. Result was that the mean auditing pace was 16.4 minutes/km.
Project IPEN and the Walkability index
IPEN is the International Physical Activity and the Environment Network (IPEN, 2011). It was launched by Professor Jim Sallis (USA), Dr Ilse DeBourdeaudhuij (Belgium) and Professor Neville Owen (Australia) at the International Congress of Behavioral Medicine in Mainz Germany in August 2004.
The network declares this aims (IPEN, 2011):
• increase communication and collaboration between researchers investigating, environmental correlates of physical activity,
• stimulate research in physical activity and the environment,
• recommend common methods and measures,
• support researchers through sharing of information, feedback, letters of support etc.
• bring together data from multiple countries for joint analyzes aid in the publication of data through papers, special journal issues, symposia etc.

Fig. 2. Logo of IPEN project
The Czech Republic also takes part in IPEN project together with 14 countries around the world. The main research department for IPEN project in the Czech Republic is the Center for Kinanthropology Research at Faculty of Physical Culture at Palacký University (CFKR, 2011).
IPEN project confirmed that the built environment – land use, structure of roads, number and location of shops, etc. has an influence on physical activity of people. Digital data about the urban environment are processed in GIS according to a recommended methodology. This methodology is described in step by step instructions. In 2011, Department of Geoinformatics at Faculty of Science at Palacký University developed a program for GIS that automatically processes all steps of spatial analysis in ArcGIS software.
The physical activity in a city environment, mainly in urban units of the city, is evaluated by Walkability index. Walkability index is calculated from four partial indexes. High value of the index means that the environment encourages dwellers to walk. Low value of Walkability index means that dwellers are forced to use cars and thus their physical activity is low in everyday life (much less than 10 000 steps).
The necessary input data for calculation of every index is a polygon geometry of urban units. The urban units are represented as a polygon feature layer with attribute table (name of urban unit, area of urban unit) in GIS. Urban units are set by Czech Statistical Office as a base unit for census. Apart from the data about the urban units, other specific data are taken into account when partial indexes are evaluated. Only vector data are necessary for calculation (no raster data). The scale of data is 1 : 10 000. All data were taken from Center for Kinanthropology Research.
Connectivity index
The first partial index that is an input for the resultant Walkability index is the Connectivity index. Connectivity is also called Intersection density. It is calculated from the number of intersections of roads per square kilometre of urban units. Input digital data is line geometry of roads in a city. Highways are excluded from the input data as they are not suitable for being walked along. Moreover, area of water bodies and rivers is subtracted from the area of urban units.
In order to calculate the index, each crossroad is assigned a Valence value. This value states the number of roads that meets at the particular crossroad. A “T” shaped crossroad has Valency value three, an “X” shaped four. An example is shown in the Fig. 3.
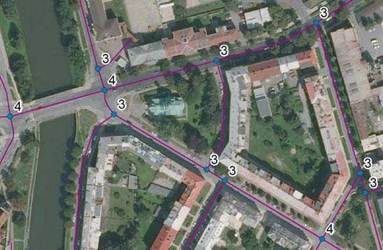
Fig. 3. Valence of intersection in the Olomouc centre
Any crossroads that are too close, that means closer than 15 m, are merged and treated as one crossroad. The distance of 15 m is recommended by the methodology of IPEN. These crossroads are then assigned higher Valence (Fig. 4).
High values of Connectivity index show that the assessed area is well interconnected. High connectivity is typical for the city centres where the conditions are not suitable for mass car transport as there are no fast road corridors and there are not enough parking spaces. In most cases, a respondent opts for walking rather than car or public transport. In addition, the distances are relatively short. In case of city centres, respondents can often be tracked within relatively small area.
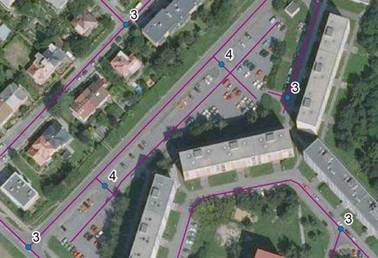
Fig. 4. Example of the merge intersection with Valence 4
The situation is, however, different for the areas of low connectivity, which are mostly those at the outskirts of the city. In these zones, dwellers usually do not work near their homes and thus have to travel longer distances, which cannot be done by active transport (on foot). People are then forced to use a car to perform most of their transport routines.
Entropy index (Shanon index)
The Entropy index represents how homogenous or heterogeneous the usage of a particular area is. The higher is the diversity of the land use, the higher is the Entropy index. The keystone of the Entropy index calculation is a high-quality land use polygon layer. The land use types are divided into following eight basic categories (Table 1).
| Name of category | Coded value |
| Living | L |
| Commercial | C |
| Services | S |
| Industrial | I |
| Institutional | T |
| Recreational | R |
| Other | O |
| Water | W |
Table 1. Type and coding of land-use according to IPEN methodology
In the USA, where the methodology was developed, each polygon (area) is expected to have exactly one type of usage. However, this assumption is not suitable for European (including the Czech) cities, where combined usage is common, especially at the city centres. We can, for example, find elements of living, commercial and institutional usage at the very same place. For that reason, at stage of analysis at the Centre of Kinantropological Research, substitutional codes were introduced to enable notation of combined use. For example, a combined use of an area which comprises of living, commercial and institutional types would be denoted by a string of three letters: LCT (living, commercial, institutional).
Evenness of distribution of building floor area of residential, commercial, and office development is the best for physical activity. If the value of entropy is high for a given district, we can expect that an inhabitant can carry out all common activities within a relatively small area. It is probable that he will be working, doing the shopping, seeking the entertainment, etc. within this district. Again in this diverse area (as far as the land use is concerned) he will have to travel some distances, yet as the distances will be short, he will probably walk. On the other hand, the situation would be different in a district with a low Entropy index. In such area, a residential or industrial type of land use prevails. People do not usually have the possibility to satisfy their needs (schooling, work, shopping, etc.) and are, therefore, forced to travel longer distances, which cannot be done on foot.
The term Entropy appears in the information theory; nevertheless, it is also very useful in mathematical statistics. Entropy is a number which determines how difficult it is to predict a value of a random quantity. It is obvious, that the prediction is more difficult if the distribution of the quantity’s values is more even. Therefore, the entropy characterizes the evenness of the distribution of values or the extent of disorder in a system (Vajda, 2004).
For the needs of the IPEN project, the equation for calculating the entropy was modified into the following form:
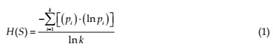
where
H(S) Entropy index (Shannon index)
pi the area of a particular category of land use over the total area of all categories
(within the scope of one district)
k the number of land use categories in the particular district
FAR Index – Floor area ratio
The FAR index represents the ratio of the area of shop buildings to the whole area of land use category labelled as commercial. It is estimated that high index shows that the place has a significant percentage of smaller retail shops. Such district will surely be more attractive for walking then the others. When the FAR index has low value, it is probable, that there are more large shops and shopping malls with extensive car parks. Therefore, it is more convenient to use a car to go shopping. Moreover, bigger shopping will be done so that the customer does not have to go shopping again soon. A region with high FAR will exhibit the opposite – inhabitants will go shopping relatively often, mostly on foot rather than by car.
The necessary data for the calculation of FAR index are all areas of buildings with commercial usage (shops, restaurants, etc.). The input into the evaluation is the point geometry (layer) of addressed points to which the size of the area is attached.
Household density index
In order to calculate the household density, it is necessary for the polygon geometry to hold information about the number of households in every urban unit. The number of households is divided by the area intended for living in the urban unit. The second necessary input is again the land use type (as it was for the Entropy index). Only zones tagged as L (living) are taken into account.
The index reflects the form of living in an urban district. High value represents high density of households. Such values are typical for the city centres, where distances are suitable for walking.
Walkability index
The Walkability index is obtained by simply adding the partial indexes: Connectivity index, Entropy index, FAR index and Household density index (Equation 2). All of the partial indexes are calculated for individual layer of urban districts. A set of partial indexes is assigned to every row of the table of urban districts. The resultant value of Walkability index is saved with each of the urban district as well.

where
WAI Walkability index
con the standard value of the Connectivity index ent the standard value of the Entropy index (Shannon index) far the standard value of the FAR (Floor area ratio) hdens the standard value of the Household density
The resultant value of Walkability index should indicate the physical activity of people in the particular district. The higher value of the Walkability index indicates the more probable it is that people will exercise more physical activity.
Utilization in urban planning
The Walkability index can be utilised by urban planners in the field of evaluation of the current state of a part of a city. Urban planners receive valuable information about the bad or good current situation in various parts of the city. Additionally, the index can be used to evaluate any newly proposed urban plans.
Moreover, the newly proposed plans can change the contemporary situation of already existing district. For example, new household zones or roads can arise in suburbanised areas. The Connectivity index changes whenever a new road is opened. A change in the Connectivity index can also be caused by a change as small as building a few short interconnecting streets or pavements in already existing urban zone. Another change can be caused by new recreational zones, industrial grounds, small shops and restaurants in current urban units. In these situations, it is possible to see the difference between the current index and the index recalculated for the proposed change. The value of the index can then serve as a clue when deciding for the final arrangement of the plan – for example the difference between a plan with a huge shopping mall can be compared to a plan that considers a lot of small shops scattered around a given area. As it is possible to see the probable effect of a change before the actual construction is realized, it is easier to eliminate or minimize unwanted effects of the new urban plan.
Program solution for the Walkability index calculation
Geographic Information Systems (GIS) are useful software for processing spatial data from the urban environment. GIS processes available spatial (graphic) data and census data in the urban units. Application ArcGIS 10 by Esri company was chosen for the data processing. The input format of all data was shapefile (SHP). Two input polygon feature classes are necessary – urban unit and land use. The third input feature class is lines of roads. The fourth input classes are points of shop with their area. The feature class of urban unit also has to contain the number of households.
There are two ways of how to process the input data according to the IPEN methodology. The first way is manual processing by interactive running of separate functions in ArcGIS. The functions are commonly called “tools” in ArcGIS. The second way is a construction of automatic program for batch processing of all data. The first way is very time consuming and requires a lot of manual work. The second way is better than first one. It fact, the second way is quicker and without operator errors.
The processing of a large amount of data can be run automatically by program extension designed especially for batch data processing. ArcGIS software offers a possibility to design the steps of data processing by data flow diagram in the graphic editor ModelBuilder. Program elements are represented by graphic elements, simply by boxes and arrows. The algorithm is simply constructed by drag-and-dropping the tools in graphic editor (Dobesova, 2011a). In some cases, the data flow diagram which is designed in ModelBuilder editor is not sufficient for all required tasks. In such cases, it is possible to automatically convert the data flow diagram into a Python language script and supplement the program code with other program constructions and commands (Dobesova, 2011b). Programming (scripting) language Python is very suitable for creating special program (script) extensions in ArcGIS. Language Python is supported by Esri and very well documented in manuals. Scripting in Python has several notable advantages. Script can call any of the tools from ArcCatalog and other methods from object Geoprocessor that are not directly accessible (Esri, 2009; 2010; Dobesova, 2011c).
A custom toolbox named “Walkability Index” was designed for the purpose of IPEN project and a case study in Olomouc at Department of Geoinformatics (Krivka, 2011). The custom toolbox can be added to ArcToolbox next to all other system toolboxes. Toolbox is situated at the bottom, according to the alphabetical order (Fig. 5).
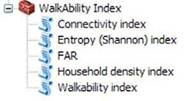
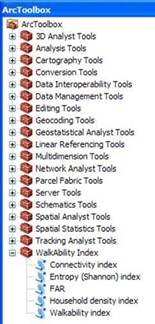
Fig. 5. Custom toolbox “Walkability Index“ in ArcToolbox in ArcGIS (left), scripts (right)
The Walkability toolbox contains five scripts. Four scripts calculate the partial indexes and the fifth one calculates the final Walkability index. Each of the scripts can be run separately, simply by double-clicking its title. Scripts then launch an interface to allow the user to set the path and name of input feature class. The mandatory parameters have a green dot next to them. The explanations (help) are on the right side of the window (Fig. 6.). Help supports a utilization of the scripts by new users.
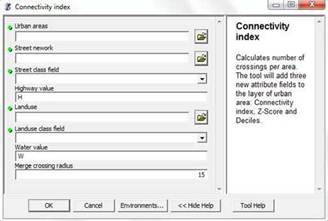
Fig. 6. Interface of a script for calculation of the Connectivity index
In our example, Python version 2.5.1 and ArcGIS version 9.3 were used. All scripts were also tested for ArcGIS version 10 and proved to be fully functional. Only the lowest licence of ArcView is necessary for running the scripts successfully. All functions, such as the subtraction of water areas from urban units, were solved directly in scripts.
The most difficult part of the script development was counting the value of Valence intersection in Connectivity index. For this purpose, a special algorithm was designed (Krivka, 2011). The idea was based on the number of crossing points with a temporal surrounding triangle (Fig. 7.).
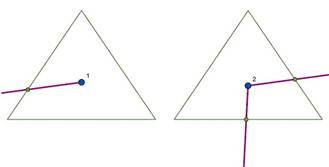
Fig. 7. Determination of the Valence value by the intersection of the surrounding triangle and the input streets
Three new attribute data are calculated for every index. The first is the absolute value of each index, the second value is the Z-score index and the third value is categorisation of Zscore to deciles (Krivka, 2011). The standard score (z-score) is quantified as a subtraction of the average from the absolute value. This difference is then divided by the standard deviation (Equation 3).
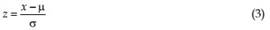
where
z Z-score
x absolute value of index
average
standard deviation
Unexpected errors in scripts were solved by “try: except:” programming construction in Python language. Information messages about successfully running calculation of indexes were displayed to user in the ArcGIS result window. Result window also was used for errors messages in different colors of text. Additionally, a user receives a total time of run
(Fig. 9).
Final toolbox is accessible from Esri web pages “Geoprocessing Model and Script Tool Gallery” (Esri, 2011).
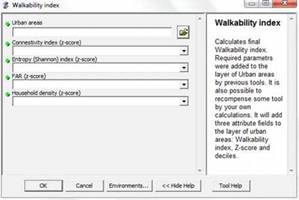
Fig. 8. Interface of the script for calculation of Walkability index – setting of the input layer and attributes
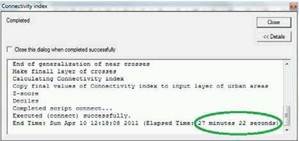
Fig. 9. A result window in ArcGIS for the Connectivity index
A case study in Olomouc city
Several regional analyses were conducted in Olomouc region and Olomouc city in the field of the citizen moving behaviour (Burian & Vozenilek, 2011). The evaluation of walkability in the city is also one of them. Custom toolbox “Walkability index” was tested on the data for Olomouc city.
Olomouc was divided into 37 urban units. Line geometry of roads was received from the municipal office. The number of households was taken from the national census data. Data about shops and area of shops was obtained by a terrain survey and by questionnaires. Fig. 10. depicts the results of calculated Walkability indexes in Olomouc. Computed values of Walkability indexes were divided into three levels: low, medium and high walkability. The source data for the map were taken from attribute “deciles of walkability” at attribute table.
The resultant values of the walkability in Olomouc corresponded with expectations. High Walkability index was measured in areas with high connectivity of street nets and household density. These areas are diverse in terms of land use and usually have a high percentage of small retail shops. The historical centre of Olomouc is located in the middle of the city and provides commercial objects as well as living area. Therefore, all urban units located in the city centre have high Walkability index.
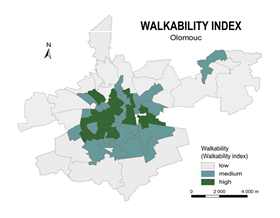
Fig. 10. Walkability index in the Olomouc urban units
At the same time, the Center for Kinanthropology Research carried out a measurement by ActiGraph. More than 350 respondents took part in the research.
For one week sensors were worn by respondents in Olomouc. However, this research was not done for all of the Olomouc parts. Grey urban units (Fig. 11) offered only small number of respondents (less than 5) and were not assessed. These units were excluded from the comparison. As the final step, the calculated values of Walkability index were compared with the data obtained by ActiGraph devices.
For the purpose of further statistical assessment, districts with notably high and low Walkability index (lower and upper three deciles) were picked. In these areas, the average number of steps of respondents were surveyed and analyzed.
It is interesting to compare the average numbers of steps with the computed values of Walkability index (Fig. 11). The highest numbers of steps were really obtained from the areas for which the calculated index was ranking high. Analogically, the lowest numbers came from the districts of the low Walkability index.
Nonetheless, the ActiGraph results from some of the researched districts did not correspond with the calculated values of walkability. This discrepancy could be cause by both insufficient number of respondents and their wrong selection. Furthermore, the methodology could be enhanced by taking the public transport and the cycling tracks into account. After a discussion with specialists, some improvements of the IPEN methodology could be introduced.
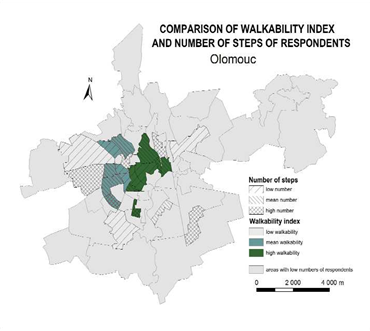
Fig. 11. Final comparison of Walkability index and the average number of steps of respondents
Conclusion
“Did you walk 10 000 steps today?” This is the questions that IPEN asks to its respondents. IPEN project proposes a method of evaluation of an urban environment using GIS. The method was transformed into a program, a “Walkability Toolbox” for ArcGIS software at Department of Geoinformatics. The advantage is that the program automatically calculates and examines the connection between the urban structure and the physical activity of dwellers. Program can be utilized in another city over the world.
Results of the case study in Olomouc also suggest a change in the IPEN method. The method, for example, does not consider the existence of public transport and its utilization by dwellers in everyday life. Dwellers can e.g. combine transport by walk to a bus and tram station. Moreover, the existence of cycling routes and bike transport is also not considered, even though cycling is also a form of active physical transport. This can be caused by the fact that (compared to, for example, Europe) the public transport and cycling is not so widespread in the USA where IPEN methodology arose. Nevertheless, calculation of the Walkability index brings significant results when evaluating an urban area.
Calculation of the Walkability index is notably useful for urban planners in the designing stage of a new urban plan. Innovative approach (walkability index) can be used for more precisely urban planning. They can automatically recalculate the Walkability index on a new version of urban plan by this program. Finally, it is possible to follow influence of the various version of urban plan on value of the Walkability index. The aim of urban planner is surly to create better city surrounding for healthy people.