Introduction
‘Level of service’ describes in a qualitative way the operational conditions for traffic from the viewpoint of the road user. It gauges the level of congestion on a highway in terms of variables such as travel time and traffic speed.
The Highway Capacity Manual in the US (TRB, 1985) lists six levels of service ranging from A (best) to F (worst). There are each defined briefly as follows:
Service A: This represents free-flow conditions where traffic flow is virtually zero. Only the geometric design features of the highway, therefore, limit the speed of the car. Comfort and convenience levels for road users are very high as vehicles have almost complete freedom to manoeuvre.
Service B: Represents reasonable free-flow conditions. Comfort and convenience levels for road users are still relatively high as vehicles have only slightly reduced freedom to manoeuvre. Minor accidents are accommodated with ease although local deterioration in traffic flow conditions would be more discernible than in service A.
Service C: Delivers stable flow conditions. Flows are at a level where small increases will cause a considerable reduction in the performance or ‘service’ of the highway. There are marked restrictions in the ability to manoeuvre and care is required when changing lane. While minor incidents can still be absorbed, major incidents will result in the formation of queues. The speed chosen by the driver is substantially affected by that of the other vehicles. Driver comfort and convenience have decreased perceptibly at this level.
Service D: The highway is operating at high-density levels but stable flow still prevails. Small increases in flow levels will result in significant operational difficulties on the highway. There are severe restrictions on a driver’s ability to manoeuvre, with poor levels of comfort and convenience.
Service E: Represents the level at which the capacity of the highway has been reached. Traffic flow conditions are best described as unstable with any traffic incident causing extensive queuing and even breakdown. Levels of comfort and convenience are very poor and all speeds are low if relatively uniform.
Service F: Describes a state of breakdown or forced flow with flows exceeding capacity. The operating conditions are highly unstable with constant queuing and traffic moving on a ‘stop-go’ basis.
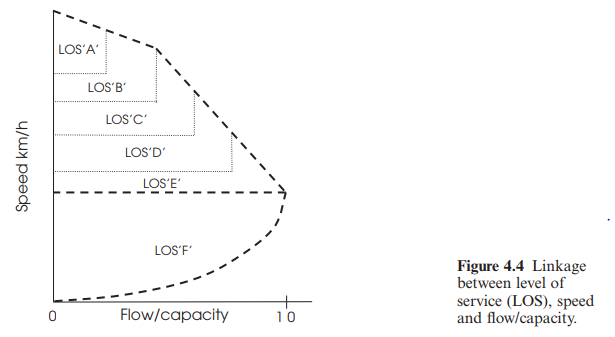
These operating conditions can be expressed graphically with reference to the basic speed-flow relationship, as illustrated in Fig. 4.3. At the level of service A, speed is near its maximum value, restricted only by the geometry of the road, and flows are low relative to the capacity of the highway, given the small number of vehicles present. At the level of service D, flows are maximised, with speed at approximately 50% of its maximum value. Level of service F denotes the ‘breakdown’ condition at which both speeds and flow levels tend towards zero.
These conditions and their associated relative speeds and flows are illustrated in Fig. 4.4.
Some definitions
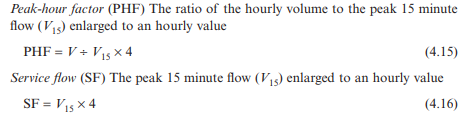
In order to determine a road’s level of service, a comprehension of the relationship between hourly volume, peak hour factor and service flow is vital:
Hourly volume (V) The highest hourly volume within a 24-hour period