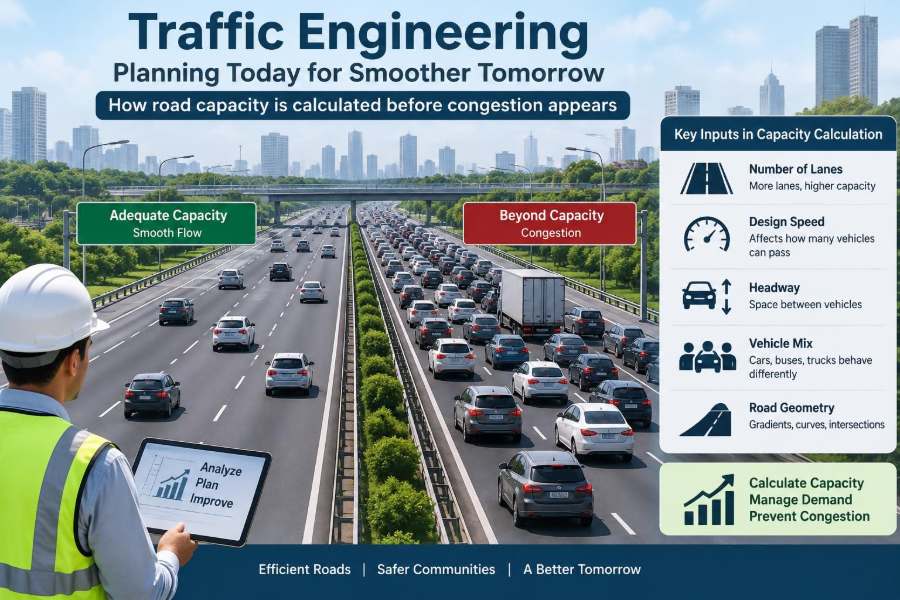

A familiar commute can change overnight. A new housing development opens, a school changes its start time, or a minor crash blocks one lane—and suddenly a junction that once felt ordinary becomes a daily queue.
It is tempting to see congestion as a simple shortage of asphalt. Yet two roads with the same number of lanes can perform very differently. One moves steadily; the other repeatedly stops, spills queues into nearby streets, and becomes unreliable long before it looks completely full.
Traffic engineering is the discipline that investigates those differences. It measures how people, vehicles, streets, signals, land uses, and human decisions interact, then uses that evidence to design safer and more dependable movement.
Road capacity is central to this work. Engineers do not wait for permanent congestion to appear before estimating it; they model demand, operating conditions, and likely future changes so that interventions can be considered while options still exist.
🚦 Traffic Engineering Is More Than Moving Cars
Traffic engineering sits within transportation engineering and focuses on the operation of streets and highways. Its scope includes traffic flow, intersection control, signs and markings, parking, pedestrian crossings, cycling facilities, crash patterns, work zones, and public transport priority.
The aim is not simply maximum vehicle speed. A street also has to be safe, understandable, accessible, and compatible with adjacent homes, shops, schools, and public spaces. A design that improves vehicle throughput while making crossings hazardous may fail the broader transport task.
🧭 The Road Is a Network, Not an Isolated Line
A road segment can have ample physical space yet perform poorly because its downstream intersection cannot discharge arriving vehicles. Conversely, a constrained link may work acceptably when demand peaks at a different time from nearby bottlenecks.
Engineers therefore examine corridors and networks, not only individual links. The location of ramps, driveways, bus stops, rail crossings, and parallel streets can all determine where delay is actually created.
📏 The Three Quantities Behind Traffic Flow
Three linked measures describe basic traffic flow: flow, speed, and density. Flow is the number of vehicles passing a point in a period, commonly expressed as vehicles per hour. Speed is the rate of movement, while density is the number of vehicles occupying a unit length of road.
They are often summarized by the relationship q = k × v, where q is flow, k is density, and v is average speed. It is a useful conceptual model: as more vehicles enter a roadway, flow can rise at first, but excessive density forces speeds down.
🚗 Capacity Has a Precise Meaning
Capacity is the maximum sustainable rate at which people or vehicles can reasonably pass a point or traverse a facility under specified conditions. The phrase “under specified conditions” matters. Lane width, heavy vehicles, weather, grades, signal timing, driver behavior, and access points all affect the result.
Capacity is not the same as observed volume. A road carrying 800 vehicles in an hour has an observed flow of 800 vehicles per hour; it may have much more or much less available capacity depending on its geometry and control.
🌊 Why More Vehicles Do Not Always Mean More Movement
At low density, drivers can select comfortable gaps and travel near their desired speed. As density rises, every driver has less room to respond, lane changes become disruptive, and braking waves can travel backward through the stream.
Near the critical point, flow reaches its practical maximum. Beyond it, unstable conditions can cause speeds and throughput to fall together. This is why adding vehicles to a nearly saturated facility can make the entire stream move less efficiently.
🕒 Demand Is the Number That Arrives
Demand is the number of trips wishing to use a facility during a given period. It can exceed capacity. When that happens, not every arriving vehicle can be served immediately; a queue forms and delay accumulates.
Morning commuting demand, a stadium exit, freight dispatch periods, and school pickup are examples of time-concentrated demand. Daily traffic totals are useful, but they can conceal the short peak periods that determine whether an intersection fails.
⚖️ Volume-to-Capacity Ratio Shows Pressure
Engineers frequently compare demand volume with capacity using a volume-to-capacity ratio, often written as v/c. A value near one indicates that demand is close to the estimated available capacity for the analysis period.
It is not a universal pass-or-fail score. A ratio depends on the analysis method, time period, and assumptions. Still, it helps reveal where modest growth, an incident, or a poorly timed signal could turn recurrent delay into a serious operational problem.
⏱️ Peak Hours Need Their Own Analysis
The busiest hour of the day is commonly used for planning, but even that hour is uneven. A sharp fifteen-minute arrival burst may overload a junction although the full hourly average seems manageable.
Analysts may apply a peak hour factor to represent how evenly demand is distributed within the hour. A lower factor indicates a more concentrated peak, which can require more careful attention to short-term queues and storage space.
🛣️ A Lane Is Not Automatically a Full-Capacity Lane
Published planning values for lane capacity are starting points, not promises. Narrow lanes, restricted sight distance, roadside friction, frequent merging, steep grades, closely spaced driveways, and poor pavement conditions can reduce practical performance.
Lane balance also matters. If three approach lanes must quickly feed one downstream lane, the merge becomes a constraint. The capacity of the corridor is governed by its limiting element, much like water flow through the narrowest section of a pipe.
🚛 Heavy Vehicles Change the Traffic Stream
Trucks and buses require more space, accelerate more slowly, and may lose speed on upgrades. Their effect is especially noticeable on steep approaches, short merge areas, and signalized intersections where slow starts consume valuable green time.
Capacity methods often convert mixed traffic into an equivalent passenger-car flow using adjustment factors. These factors are not judgments about vehicle value; they are a way to represent differences in operational space and acceleration.
⛰️ Geometry Quietly Sets Operating Conditions
Vertical grades, horizontal curves, lane widths, shoulder space, and available sight distance influence what drivers can safely and comfortably do. A grade that looks minor on a plan may become important where loaded trucks climb during the commuter peak.
Good geometric design supports predictable behavior. When drivers must brake suddenly because a curve, merge, or crossing is revealed too late, capacity and safety both suffer.
🔀 Intersections Usually Control the Corridor
On urban streets, intersections frequently determine overall travel time more than midblock lane count. A vehicle can move freely between signals and still spend much of its trip waiting for red indications or queues to clear.
Each turning movement competes for time and space. Left turns may need protected phases, pedestrians require crossing time, and buses may dwell near corners. Capacity analysis separates these movements instead of treating the whole approach as one undifferentiated stream.
🚥 Signal Timing Allocates a Limited Resource
A signal cycle divides time among competing movements. The green interval is useful only after startup delay, clearance intervals, pedestrian requirements, and the actual ability of vehicles to discharge are considered.
Green time is not created by retiming; it is redistributed. Giving more time to a major road can reduce its queue while increasing delay on side streets or at a nearby coordinated junction. Timing is therefore a network decision, not a single-intersection trick.
🟢 Saturation Flow Explains Queue Discharge
When a standing queue receives green, the first few vehicles take time to react and begin moving. After that startup period, queued vehicles may pass the stop line at a relatively steady maximum rate called saturation flow.
The achievable capacity of a lane group depends largely on this discharge rate and its effective green share. Turning traffic, buses, grades, pedestrians, and lane use can reduce it. Field observations help ensure calculations reflect local conditions rather than idealized assumptions.
🚶 People Crossing Are Part of the Capacity Calculation
Pedestrian phases and turning conflicts are not inconveniences to be engineered away. They reflect a street’s purpose: carrying people safely. At busy crossings, turning vehicles may yield through much of their green time, lowering vehicle discharge capacity.
The right response may be a protected turn phase, a shorter crossing distance, a refuge island, revised signal phasing, lower speeds, or better transit access. The appropriate solution depends on the safety problem and the people using the place.
🚌 Transit Can Reduce Vehicle Demand—or Add Friction
A well-used bus, tram, or rail service can move many people without requiring each person to drive. This can reduce vehicle demand at critical points, particularly when service is reliable and stops are well connected to walking routes.
At the street level, poorly placed stops can interrupt a traffic lane and create delay. Bus bays may reduce that delay but can make buses struggle to re-enter traffic. There is no universal layout; passenger reliability, accessibility, street width, and traffic conditions must be weighed together.
🚲 Capacity Should Be Measured in People Where Possible
A road designed only around vehicles may overlook its most valuable output: people reaching destinations. A general traffic lane, a bus lane, a protected cycle track, and a wide footway can move very different numbers of people in the same corridor width.
This does not mean every street should use the same allocation. It means engineers should state the objective clearly. A freight route, a town-center main street, and an emergency access corridor have different functions and should be evaluated accordingly.
🏪 Driveways and Parking Create Roadside Friction
Every driveway introduces entering, exiting, slowing, and turning movements. Frequent curbside parking activity adds door opening, loading, pull-outs, and blocked sight lines. Individually small disruptions can collectively lower speed and usable capacity.
Access management groups or limits conflict points through shared entrances, median design, service roads, and sensible spacing. It can improve operations, but it must also preserve practical access for properties and emergency services.
📊 Data Collection Turns Observation Into Evidence
Traffic counts remain fundamental. Engineers may count vehicles by movement at intersections, classify vehicles, record pedestrian and cyclist volumes, measure travel times, and observe queues. Automated sensors, video analytics, probe-vehicle data, and manual surveys can all contribute.
Each source has limitations. A short count may miss seasonal variation; probe data may underrepresent some users; video classifications require quality checks. The best analysis asks whether the data matches the decision being made.
🧮 Forecasting Begins With Land Use and Trips
For a proposed development, engineers estimate the trips it may generate, when those trips occur, where they come from, and which routes they use. Residential, retail, industrial, school, and medical uses can have very different peak patterns.
Trip estimates are not exact forecasts of individual behavior. They are planning tools refined with local context: transit availability, walking connections, parking supply, existing travel patterns, and the likelihood of pass-by or shared trips.
🗺️ Distribution and Assignment Locate Future Pressure
After estimating trips, analysts distribute them between origins and destinations, then assign them to likely routes. A new site may generate substantial trips without overloading the nearest junction if travel disperses across several access points and times.
Models simplify reality. Drivers adapt to congestion, navigation tools, tolls, weather, and personal preferences. Scenario testing is useful precisely because it exposes how conclusions change when key assumptions change.
🧪 Scenario Analysis Tests Decisions Before Construction
A credible traffic study rarely offers one forecast as certainty. It compares scenarios: existing conditions, future background growth, development traffic, planned network improvements, different access arrangements, and sometimes incident or construction conditions.
A hypothetical example is a supermarket proposal near a busy signal. Engineers might test a new driveway, a shared access road, revised delivery hours, pedestrian improvements, and signal changes. The result should show trade-offs, not merely justify a predetermined layout.
📉 Level of Service Is Useful but Incomplete
Level of service, often expressed with letter grades in some practice frameworks, is a familiar way to communicate delay, density, or operating quality. It can make technical results easier to discuss.
However, a single grade can hide important realities: queue length, crash risk, crossing comfort, bus reliability, emissions from idling, or unequal delay among movements. It should be one indicator in a wider operational and safety assessment.
🚧 Queues Need Physical Storage Space
A queue is not only a delay measure; it occupies real pavement. If a left-turn bay is shorter than the expected queue, vehicles can block through lanes. If an off-ramp queue reaches the mainline, it can create a high-risk conflict.
Queue analysis considers both average and higher-demand conditions. Designing only for an average queue may look efficient on paper yet fail during routine variations in arrivals.
🌧️ Incidents and Weather Reveal Hidden Fragility
Capacity estimates are normally tied to stated conditions, but real networks face rain, reduced visibility, stalled vehicles, crashes, work zones, special events, and equipment failures. Near-capacity facilities have little spare room to absorb these disruptions.
Resilience may come from incident management, clear diversion routes, reliable signal maintenance, reversible operational plans, and alternative modes. Extra lanes are sometimes appropriate, but operational preparedness can be equally significant.
🏗️ Construction Phasing Must Keep the Network Working
Road construction changes lane widths, merges, travel paths, sight distance, and driver expectations. A work-zone traffic plan should assess expected demand, queue spillback, pedestrian continuity, access for emergency vehicles, and the safest arrangement for workers.
Temporary capacity reductions are often unavoidable. Communicating changes, sequencing high-impact work outside the busiest periods where feasible, and monitoring actual queues can prevent a temporary scheme from causing avoidable network-wide disruption.
⚠️ Common Errors in Capacity Studies
Weak studies often treat a model output as a fact rather than the result of assumptions. They may use outdated counts, ignore nearby projects, assess only one peak period, or overlook the downstream junction where queues will actually accumulate.
- Using daily totals to infer peak-hour performance.
- Assuming every added lane remains useful through downstream bottlenecks.
- Counting vehicles but not pedestrians, cyclists, buses, or freight movements.
- Ignoring queue storage and spillback.
- Presenting future demand without sensitivity testing.
Transparent assumptions and field validation are more valuable than false precision.
🔧 Improving Capacity Does Not Always Mean Widening
Sometimes the best improvement is operational: better signal coordination, a revised turn lane, access consolidation, a safer crossing that reduces erratic yielding, curb management, loading restrictions, transit priority, or a school travel plan.
Widening can relieve a localized constraint, but it may be costly, require property acquisition, increase crossing distance, or simply shift queues to the next bottleneck. A solution should address the source of failure rather than its most visible symptom.
🌱 Demand Management Changes the Calculation
When peak demand is the problem, reducing or shifting that demand can be as meaningful as increasing supply. Flexible work hours, carpooling, remote services, transit improvements, pricing policies where appropriate, and staggered school or delivery schedules can alter peak patterns.
These measures depend on local equity, practicality, and available alternatives. They are not substitutes for safe infrastructure, but they can help a constrained network operate more reliably.
🛡️ Safety Cannot Be Traded Away for Throughput
A capacity increase that raises speeds through a pedestrian district or encourages risky gaps at a junction has a serious cost. Traffic engineering uses crash history, conflict observations, speed data, sight-distance checks, and road-user behavior alongside flow analysis.
Safe systems anticipate human mistakes. Lower conflict speeds, simpler movements, protected crossings, forgiving roadside design, and understandable control can reduce the consequences when errors occur.
🧠 The Core Principle: Balance Demand, Capacity, and Place
Road capacity is not a fixed number stamped onto a map. It is an operating outcome shaped by demand patterns, geometry, control, vehicle mix, weather, downstream constraints, and the needs of people outside vehicles.
The strongest traffic engineering work defines the problem carefully, measures real conditions, tests uncertainty, and compares options against safety, reliability, access, and community function. That is how planners can act before recurring congestion becomes the only evidence everyone can see.
Good traffic engineering is not about making every vehicle move fastest; it is about helping a whole transport system move people safely, predictably, and appropriately for the place it serves. 🌉🚦🚶