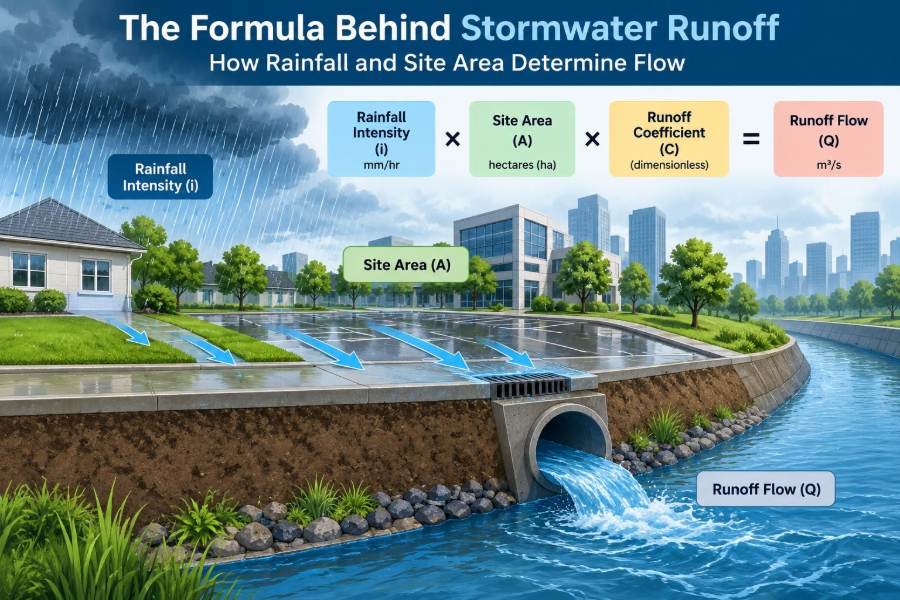

A sudden summer downpour can turn a quiet parking lot into a shallow pond within minutes. Water races along curbs, collects at low points, and tests whether the nearest inlet can accept it fast enough.
That visible flow is not random. It is the outcome of rainfall intensity, drainage area, surface type, slope, and the time available for water to reach a collection point.
For civil engineers, estimating runoff is a foundation of site design. It influences the size of storm sewers, culverts, swales, detention basins, roof drains, and many other parts of drainage infrastructure.
The first useful question is simple: when rain falls on a site, how much water becomes runoff, and how quickly does it arrive? A compact formula provides an early answer, but using it well requires sound engineering judgment.
🌧️ What Stormwater Runoff Means
Stormwater runoff is precipitation that flows over land, roofs, pavements, or other surfaces toward a drainage system, channel, or low point. It begins when rainfall cannot infiltrate into the soil or be stored temporarily on the surface.
Some rain soaks into soil, some is held by vegetation, and some evaporates. The remainder may travel downslope as shallow sheet flow, then concentrate into gutters, ditches, pipes, and streams.
💧 Why Engineers Estimate Peak Flow
Drainage facilities must safely convey or store water during a selected design storm. For a pipe or inlet, the critical question is often the peak discharge: the greatest expected flow rate at a particular location.
A system that is too small may surcharge, flood roads, damage buildings, or erode channels. A system made unnecessarily large can consume project budget, utility space, and construction effort without delivering proportionate benefit.
📐 The Rational Method Formula
For many small drainage areas, engineers begin with the Rational Method:
Q = C i A
In this expression, Q is peak runoff rate, C is the runoff coefficient, i is rainfall intensity, and A is drainage area. The formula is simple, but each input represents a real physical condition on the site.
Unit conventions matter. In common U.S. customary practice, Q in cubic feet per second is obtained when i is in inches per hour, A is in acres, and the appropriate conversion convention is used; many practical forms include a unit factor. In SI practice, a conversion factor is generally required when intensity is in millimetres per hour and area is in hectares. Always verify the form required by the governing agency or design standard.
🧠 The Core Assumption Behind the Formula
The Rational Method assumes that runoff from the entire contributing area is reaching the outlet when the peak occurs. This is why rainfall intensity is tied to a specific storm duration rather than selected arbitrarily.
It is best suited to relatively small, fairly uniform catchments where rainfall can reasonably be treated as uniform over the area. It is not a complete rainfall-runoff simulation, and it does not produce a full runoff hydrograph.
☔ Rainfall Intensity Is More Than Total Rainfall
Rainfall depth tells us how much rain falls over a period, such as 25 millimetres in a day. Rainfall intensity tells us the rate at which it falls, such as millimetres per hour.
Two storms can have the same total depth but create very different drainage demands. A gentle all-day rain may infiltrate or drain gradually, while a short burst with high intensity can overwhelm inlets and create a high peak flow.
⏱️ Selecting the Design Storm Duration
The rainfall intensity used in the Rational Method is typically associated with a duration equal to the site’s time of concentration. This is the estimated travel time for runoff from the hydraulically most remote point in the drainage area to reach the point being designed.
A small, steep paved site may have a short time of concentration and therefore use a short-duration, high-intensity rainfall value. A larger site with long shallow flow paths generally has a longer travel time and often a lower corresponding intensity.
🗺️ Understanding Rainfall Frequency
Design rainfall also has a selected frequency, often described through annual exceedance probability or a return-period convention. Local regulations commonly specify the event to use for public systems, private sites, culverts, or detention facilities.
A more severe design event generally produces a greater rainfall intensity and a larger design flow. The appropriate choice depends on consequences, governing criteria, downstream risk, and the type of infrastructure—not simply on a desire to use the largest available storm.
📍 Where Rainfall Data Comes From
Engineers obtain design intensities from approved local sources, such as municipal criteria, regional rainfall-frequency data, or intensity-duration-frequency curves. These curves relate storm intensity to both duration and frequency.
Using values from a nearby city, an outdated table, or an unverified online source can lead to a mismatch with local climate records and permitting requirements. The project’s jurisdiction usually controls the acceptable source and application method.
🏞️ Defining the Drainage Area
The drainage area is the land surface that contributes runoff to the point under consideration. It is not necessarily the property area, the paved area, or the area inside a drawing boundary.
Grade breaks, curbs, roof leaders, retaining walls, swales, and adjacent upstream land can all change the contributing area. A single development often contains several subcatchments because water reaches different inlets or outlets by different paths.
🧭 Delineating a Catchment on a Plan
Catchment delineation starts with topography and finished grading. Trace the direction water would take across the proposed surface, then identify ridges or barriers that divide one drainage path from another.
- Use existing contours for predevelopment analysis.
- Use proposed spot elevations, curb lines, and grading plans for final design.
- Check roof drainage separately when downspouts discharge to a specific system.
- Include off-site runoff that enters the project unless it is intercepted elsewhere.
A drainage boundary should reflect actual flow, not administrative ownership.
🏙️ What the Runoff Coefficient Represents
The runoff coefficient, C, estimates the fraction of rainfall intensity that becomes direct peak runoff. It is a practical representation of surface response rather than a universal physical constant.
Impervious surfaces such as roofs and asphalt generally have high coefficients because little water infiltrates. Lawns, wooded areas, and permeable soils often have lower coefficients, although they can still produce substantial runoff when soil is saturated, compacted, frozen, or steep.
🧱 How Surface Type Changes Runoff
A roof usually routes water quickly to gutters or downspouts, producing a rapid and concentrated response. Pavement behaves similarly, especially when it drains toward a curb and inlet.
Vegetated ground can intercept rainfall, temporarily store water in surface depressions, and allow infiltration. These processes reduce or delay runoff, but their effect varies with soil condition, maintenance, antecedent moisture, and slope.
🌱 Why Soil Conditions Cannot Be Ignored
Soil texture, compaction, layering, and groundwater conditions influence infiltration. Construction activity often compacts exposed soils, reducing their ability to accept water compared with undisturbed ground.
A landscaped area should not automatically be treated as highly pervious. Thin topsoil over compacted fill, poor grading, or frequent foot traffic can make its runoff behaviour much closer to that of a harder surface during intense rain.
🧩 Computing a Composite Runoff Coefficient
When a catchment contains several surface types, engineers often calculate an area-weighted composite coefficient. The approach gives more influence to surfaces occupying more area.
Cweighted = (C₁A₁ + C₂A₂ + ... + CₙAₙ) / Atotal
For example, a hypothetical site with roof, pavement, and lawn would use the coefficient for each surface multiplied by its respective area, then divide the sum by total drainage area. This is more representative than choosing one coefficient based only on the dominant surface.
🧮 A Simple Hypothetical Calculation
Consider a small parking-area catchment of 0.8 hectares with a selected composite coefficient of 0.75. Suppose applicable rainfall data gives an intensity of 65 millimetres per hour for the required duration and frequency.
The inputs indicate that the site is fairly impervious and exposed to a relatively intense burst of rain. Using an SI form of the Rational Method requires the correct unit conversion factor; with intensity in millimetres per hour and area in hectares, a commonly used form is Q = 0.00278CiA, yielding approximately 0.108 cubic metres per second.
This is an illustrative calculation only. A real design must use jurisdiction-approved rainfall data, runoff coefficients, routing assumptions, and safety criteria.
🔢 Keep Units Consistent
Unit errors can quietly produce major design errors. A calculation may look organized while mixing hectares with acres, millimetres per hour with inches per hour, or cubic metres per second with litres per second.
| Quantity | Common SI expression | Common U.S. customary expression |
|---|---|---|
| Peak flow | m³/s or L/s | ft³/s |
| Rainfall intensity | mm/h | in/h |
| Area | ha or m² | acres or ft² |
| Coefficient | dimensionless | dimensionless |
Write units beside every value until the calculation method becomes familiar. Do not assume a software template uses the same convention as a local manual.
⛰️ The Role of Slope and Flow Path
Slope does not appear directly in Q = CiA, but it strongly affects travel time. Steeper paths typically move runoff more quickly, which can shorten time of concentration and increase the rainfall intensity selected from an IDF curve.
Surface roughness matters too. Water crossing a rough lawn moves differently from water flowing along smooth pavement or inside a pipe. Travel-time estimates should account for the actual sequence of sheet flow, shallow concentrated flow, and channel or pipe flow.
🚗 Imperviousness and Urban Development
Development often replaces soil and vegetation with roofs, driveways, sidewalks, and parking areas. It can also connect previously dispersed runoff into curbs and storm sewers that deliver water to an outlet more efficiently.
The result is commonly a higher and earlier peak flow. This is why redevelopment may require drainage upgrades or on-site stormwater controls even when the property boundary and overall area remain unchanged.
🏠 Roofs Are Small Catchments with Fast Response
Roofs deserve careful attention because their drainage paths are usually direct. Gutters, scuppers, downspouts, roof drains, and leaders can concentrate runoff at a single point that may be close to a building foundation or pedestrian route.
For roof drainage, confirm where the water goes after it leaves the roof. A downspout discharging onto a sloped walkway or undersized splash area can create erosion, ice hazards, or nuisance ponding even if the roof drain itself is adequate.
🕳️ Inlets and Pipes Must Work as a System
Calculating runoff to an inlet is not the same as proving that the inlet will capture it. Grate type, curb opening geometry, gutter spread, street slope, clogging risk, and bypass flow all affect inlet performance.
Downstream pipes must also have enough capacity under the applicable hydraulic assumptions. A generously sized inlet connected to a restricted pipe can still lead to upstream ponding and surcharge.
🌊 Detention Changes Timing, Not Rainfall
Detention systems temporarily store runoff and release it at a controlled rate. They do not make the design storm disappear; they reshape the runoff response by reducing the discharge sent downstream at one time.
A basin, vault, oversized pipe, or similar facility must be analyzed with storage-routing methods when timing matters. The Rational Method may help estimate inflow peaks for small systems, but storage design typically requires a hydrograph-based approach and applicable local procedures.
🌿 Green Infrastructure Alters the Runoff Path
Bioretention areas, permeable pavement, vegetated swales, rain gardens, and green roofs can slow, store, filter, infiltrate, or evapotranspire part of stormwater. Their benefit depends on design details, soil media, drainage layers, underdrains, overflow routes, and maintenance.
These features should not be assigned reduced runoff values without a method recognized by the governing design criteria. A clogged permeable surface or a bioretention area with poor underdrain function may behave very differently from the intended design.
🛣️ Predevelopment and Postdevelopment Comparisons
Comparing existing and proposed conditions helps reveal how a project changes drainage behaviour. The comparison may consider peak rate, runoff volume, time to peak, flow path, water quality treatment, and downstream receiving conditions.
A project can maintain a similar peak rate at one outlet while still increasing runoff volume or shifting water toward a different downstream area. Good analysis looks beyond one number when site changes are substantial.
⚠️ Common Mistake: Using the Entire Site for Every Inlet
Each inlet or structure should be evaluated with the area that actually drains to it. Applying the entire site area to every inlet exaggerates local flow and can distort pipe sizing throughout the network.
Conversely, omitting a small paved strip, upstream roof, or off-site swale may underestimate flow at a critical low point. Delineation should be updated whenever grading or drainage routing changes.
⚠️ Common Mistake: Choosing a Coefficient by Appearance
A site with visible grass may still drain quickly if soils are compacted and slopes direct water toward a swale. Likewise, a paved surface with distributed storage and controlled routing may not behave exactly like a simple uniform parking lot.
Use coefficient ranges and selection guidance from accepted local criteria. Then document why the selected value fits the site’s surfaces, slopes, land use, and design condition.
⚠️ Common Mistake: Ignoring Overflow Routes
Every drainage system has a limit. When an inlet clogs, a pipe reaches capacity, or a storm exceeds the design event, water follows the land surface.
Designers should identify a major drainage path that directs exceedance flow away from buildings, electrical equipment, deep drop-offs, and other vulnerable locations. A safe overflow route is an essential companion to underground capacity.
🧰 A Practical Calculation Workflow
- Identify the design point: inlet, pipe junction, culvert, outlet, or storage facility.
- Delineate the tributary drainage area from current or proposed grades.
- Separate distinct land covers and calculate a composite coefficient if needed.
- Estimate time of concentration from the actual flow path.
- Select rainfall intensity for the required duration and frequency.
- Apply the correct Rational Method equation and units.
- Check inlet capture, pipe capacity, ponding, overflow, and downstream effects.
This sequence reduces a common failure mode: treating the equation as the entire design rather than one step within a drainage system evaluation.
🖥️ How Spreadsheets and Models Help
Spreadsheets are useful for organizing subcatchments, areas, coefficients, intensities, and pipe calculations. Their transparency can make review easier when formulas, units, and assumptions are clearly shown.
More detailed hydrologic and hydraulic models can represent runoff hydrographs, routing, storage, backwater, and network interactions. A model is valuable when the problem requires that detail, but it still depends on correct terrain, rainfall, surface, and boundary-condition inputs.
🔍 Field Observations Improve Desk Calculations
Site visits often reveal drainage features that are missing from plans: a sag point at a driveway, a blocked ditch, an informal swale, settled pavement, or an upstream area draining through a fence opening.
After storms, observe where water ponds, how long it remains, and whether it bypasses intended inlets. These observations do not replace design calculations, but they are powerful checks on whether the assumed flow paths are realistic.
📋 Documentation Makes Design Review Stronger
A clear drainage calculation package shows more than a final Q value. It should identify drainage areas, land-cover assumptions, rainfall source, storm frequency, time-of-concentration method, coefficients, unit conventions, and downstream design checks.
Concise notes can prevent confusion later, especially if grading revisions alter a catchment boundary. Transparent assumptions also make it easier for reviewers and future engineers to understand the design intent.
🎯 When the Rational Method Is Not Enough
For large watersheds, complex storage networks, floodplain work, long-duration storms, or projects where volume and timing are central, a simple peak-flow method may be inadequate. Hydrograph-based methods can better represent how runoff changes over time.
The correct method depends on project scale, regulatory requirements, available data, and the consequences of error. Engineering judgment means recognizing both the value and the limits of a familiar formula.
🧭 The Formula’s Real Lesson
Q = CiA connects a site’s physical character to its drainage demand. More intense rain increases flow; a larger contributing area increases flow; and more runoff-prone surfaces increase flow.
But the formula only becomes meaningful when those terms are chosen from a defensible understanding of grades, surfaces, soil conditions, travel paths, rainfall data, and infrastructure performance. Stormwater design is not just arithmetic—it is the disciplined translation of a landscape into how water will move across it.
When rainfall intensity, contributing area, and site response are defined carefully, the runoff calculation becomes a reliable starting point for safer drainage decisions. 🌧️📐💧